
What this is
- This research investigates the role of in aging cochlear hair cells.
- (D-gal) was used to induce aging in HEI-OC1 cells and cochlear explants.
- Findings indicate that overexpression activates and slows aging processes in these cells.
Essence
- overexpression activates and slows aging in cochlear hair cells exposed to . D-gal treatment reduces levels and impairs , linking cellular metabolism and aging.
Key takeaways
- levels decrease significantly in cochlear hair cells treated with . This reduction correlates with impaired and increased aging markers.
- Overexpression of restores and reduces aging markers in D-gal-treated HEI-OC1 cells. This suggests 's potential as a therapeutic target for age-related hearing loss.
- Metabolomic analysis shows that regulates the tricarboxylic acid cycle, which is disrupted in -knockout cells, indicating its crucial role in cellular metabolism.
Caveats
- The study primarily uses in vitro models, which may not fully replicate in vivo conditions. Further research is needed to confirm these findings in live organisms.
- The specific mechanisms by which regulates and metabolism during aging remain unclear, necessitating additional investigation.
Definitions
- autophagy: A cellular process that degrades and recycles damaged organelles and proteins to maintain cellular health.
- D-galactose (D-gal): A sugar that, at high concentrations, can induce aging-like effects in cells.
- NMNAT1: Nicotinamide nucleotide adenylate transferase 1, an enzyme crucial for NAD biosynthesis and cellular metabolism.
Simplified
Introduction
With an aging population, the incidence of age‐related hearing loss (ARHL) continues to increase (Dzau and Balatbat 2018). Among these, age‐related hearing loss (ARHL) is the most prevalent sensory disturbance affecting the aged. Clinically, ARHL typically presents as bilateral symmetrical hearing loss that begins at high sound frequencies and gradually progresses to medium and low frequencies (Davalli et al. 2016). As its incidence increases with age, ARHL has become the predominant cause of hearing disability among aged. According to the World Hearing Report, over 65% of individuals aged ≥ 60 years exhibited a certain degree of hearing loss (WHO 2021). This impairment can result in significant social isolation, communication challenges, depression, and even cognitive decline in older adults (Jafari et al. 2021; Uchida et al. 2019). The pathogenesis of ARHL remains inadequately understood, underscoring the urgent need for further research to elucidate the potential mechanisms and enhance clinical diagnosis and treatment.
ARHL is a chronic, age‐associated condition that is caused by cumulative effects of harmful lesions and dysfunction within the auditory system (Eckert et al. 2021). The cochlea is the primary site of ARHL‐related pathology, with characteristic alterations, including damage to hair cells and spiral ganglion neurons (Youn et al. 2020; Tawfik et al. 2020). Reduced cochlear vascularization, DNA damage, ROS accumulation, and mitochondrial dysfunction are the primary contributors to cochlear lesions (Bazard et al. 2021; Kociszewska and Vlajkovic 2022; Yang et al. 2023). With aging, diminished cellular metabolism and self‐repair capabilities cause damaged organelles and misfolded proteins to accumulate (Ye et al. 2018). Nicotinamide adenine dinucleotide (NAD) is a cofactor for maintaining enzyme function associated with energy metabolism and mitochondrial stability (Wu et al. 2024; Navas and Carnero 2021; Lautrup et al. 2019). Notably, NAD+ levels decline with age (McReynolds et al. 2020; Covarrubias et al. 2021). Both total NAD+ levels and the NAD+/NADH ratio were significantly reduced in the hair cells of aged mice. Short‐ and long‐term NAD+ supplementation in these mice enhances synaptic connectivity between hair cells and auditory neurons, thereby mitigating ARHL (Okur et al. 2020, 2023).
Macroautophagy (hereafter referred to as autophagy) is specifically crucial for preserving protein stability, organelle integrity, and overall cellular health and viability (Debnath et al. 2023; Levine and Kroemer 2019). Autophagy declines in aging cells, coinciding with reduced NAD+ levels—increasing the NAD+ pool or enhancing autophagy alone helps slow the aging process (Bjedov et al. 2020; Mitchell et al. 2018). NAD+ plays a crucial role in regulating cellular autophagy. Sirtuin 1 (SIRT1) activates various autophagy‐related proteins through NAD+‐dependent histone deacetylation (Yu et al. 2024). Pang et al. (2019) reported that SIRT1 expression and autophagy were reduced in aged mice hair cells. By activating SIRT1, autophagy is enhanced by deacetylating autophagy‐related protein 9A, an autophagy‐related protein—that consequently mitigates age‐related hair cell loss (Xiong et al. 2019; Pang et al. 2019). However, the mechanisms underlying autophagy regulation in ARHL require further assessment.
Nicotinamide nucleotide adenylate transferase 1 (NMNAT1) is a key enzyme in the biosynthesis of NAD+, maintaining intracellular NAD+ levels and NAD+/NADH ratio (Huang et al. 2024; Shi et al. 2021; Sokolov et al. 2021). In Werner syndrome, the transcriptional suppression of Nmnat1 reduces NAD+ levels, thereby accelerating aging. NAD+ supplementation significantly alleviates accelerated aging (Fang et al. 2019). During hypoxic stress, NMNAT1 overexpression enhances autophagy and protects neuronal dendrites from hypoxia‐induced damage (Wen et al. 2013). Additionally, NMNAT1 activation prevents acute ischemic stroke in aging rats by modulating the SIRT1/mTOR pathway that induces autophagy during focal cerebral ischemia (Wang et al. 2019). In Alzheimer's disease (AD), NMNAT1 overexpression facilitates amyloid clearance through autophagy activation (Zhu et al. 2022). However, the specific role of NMNAT1 in ARHL remains unclear.
In our study, we assessed the regulatory relationship between NMNAT1 and autophagy in ARHL mice. D‐galactose (D‐gal) was used to induce aging in HEI‐OC1 (House Ear Institute‐Organ of Corti 1) cells and cochlear explants to establish ARHL model, as previously reported (He, Li, et al. 2021; Zhao et al. 2022). Our results demonstrated that NAD+ and autophagy levels were markedly reduced in the D‐gal‐induced ARHL model. NMNAT1 overexpression restores autophagic activity and decelerates aging in cochlear hair cells. Our results offer novel insights into the relationship between NMNAT1, autophagy, and aging, revealing NMNAT1 as a promising target for the clinical management of ARHL.
Materials and Methods
Animals
Friend Virus B‐type (FVB) mice were purchased from SiPeiFu Biotechnology (Beijing, China) and maintained at the Core for Laboratory Animal Medicine, Institute of Health and Medicine, Hefei Comprehensive National Science Center, China. Postnatal day 3 (P3) FVB mice were used for cochlear explant culture. FVB mice were selected based on their well‐defined genetic background, high fecundity, and large litter size, ensuring a consistent and sufficient supply of experimental animals. The cochleae were dissected and immediately placed in precooled Hank's balanced salt solution (HBSS, 14175095; Gibco). The cochlear volute was carefully removed under a dissecting microscope using forceps, and the basement membrane along with the spiral ligament was gently isolated. Subsequently, the basement membrane was separated from the spiral ligament, adhered to an 8 mm glass slide pre‐coated with Cell‐Tak (354240; Corning), and transferred into a 4‐well culture dish. Each well contained 2 mL Dulbecco's modified Eagle's medium (DMEM) (C11995500BT; Gibco) supplemented with 1% N2 (A1370701; Gibco), 2% B27 (17504044; Gibco), and 50 μg/mL ampicillin (A0166; Sigma‐Aldrich). The cultures were incubated at 37°C with 5% CO2. All animal experiments were conducted in strict accordance with the ethical guidelines for laboratory animals established by the Anhui Medical University, China.
Cell Culture
HEI‐OC1 cells (M8‐0401) were obtained from Cyagen (Guangzhou, China). Cells were maintained in DMEM supplemented with 10% fetal bovine serum (FBS) and 50 μg/mL ampicillin at 33°C in a 10% CO2 incubator. When the cells were approximately 90% confluence, they were digested into single‐cell suspensions using 0.25% trypsin‐ethylenediaminetetraacetic acid (EDTA) (25200054; Thermo Fisher Scientific) for passaging and subsequent experiments.
Cell Counting Kit‐8 Assay
HEI‐OC1 cells were plated in 96‐well plates (100 μL per well) and cultured for 12–24 h. Once the cell density reached 60%–70%, they were treated with DMEM containing 2, 5, 10, 20, and 40 mg/mL D‐gal (G7050; Sigma‐Aldrich) for 72 h. Subsequently, 100 μL DMEM supplemented with 10% Cell Counting Kit‐8 solution (HY‐K0301; MCE) was added to each well. After incubation at 37°C for 2 h, the absorbance at 450 nm was measured using a microplate reader (Bio‐Rad). Cell viability was calculated using the formula: Cell viability (%) = ([As−Ab]/[Ac − Ab]) × 100%—where As represents the absorbance of the experimental wells (cells, culture medium and CCK‐8 solution, with drugs); Ac represents the absorbance of control wells (cells, culture medium and CCK‐8 solution, without drugs); and Ab represents the absorbance of blank wells (medium, CCK‐8 solution, without cells and drugs).
Mito‐/‐Staining Analysis SOX DCFH DA
The MitoBright ROS Deep Red‐Mitochondrial Superoxide Detection Kit (MT16; DOJINDO) and ROS Assay Kit‐Highly Sensitive DCFH‐DA (R252; DOJINDO) were purchased from DOJINDO. HEI‐OC1 cells were treated with D‐gal (5 and 20 mg/mL) for 72 h. After treatment, the culture medium was removed, and the cells were washed twice with phosphate‐buffered saline (PBS). Following incubation with Mito‐SOX or DCFH‐DA reagent at 37°C for 30 min. Subsequently, the cells were mounted on slides for confocal imaging (LSM900; ZEISS).
Flow Cytometry Analysis
HEI‐OC1 cells were treated with D‐gal (5 and 20 mg/mL) for 72 h. The cells were harvested using trypsin (15090046; Gibco), incubated with Mito‐SOX or DCFH‐DA reagent at 37°C for 30 min. Then, the cells were resuspended with PBS for flow cytometry analysis.
Western Blotting
Proteins were extracted from HEI‐OC1 cells and cochlear explants using RIPA buffer (P0013B; Beyotime) supplemented with a protease inhibitor cocktail (04693132001; Roche, Basel, Switzerland). Protein concentration was estimated using the bicinchoninic acid Enhanced Protein Assay Kit (P0010; Beyotime). The primary antibodies used in this study were as follows: rabbit anti‐β‐tubulin (1:40000, 5568; CST), rabbit anti‐β‐Actin (1:40000, 20536‐1‐AP; Proteintech), mouse anti‐GAPDH (1:4000, ab8245; Abcam), rabbit anti‐senescence marker protein‐30 (SMP30) (1:1000, 17947‐1‐AP; Proteintech), rabbit anti‐lamin B1 (1:1000, 13435; CST), rabbit anti‐γ‐H2A.X (1:400, 2577; CST), rabbit anti‐P21 (1:1000, 37543; CST), rabbit anti‐P16 (1:1000, 29271; CST), rabbit anti‐NMNAT1 (1:1000, 98354; CST), rabbit anti‐NMNAT1 (1:400, 11399‐1‐AP; Proteintech), rabbit anti‐LC3B (1:1000, 3868; CST), rabbit anti‐P62 (1:1000, 23214; CST), mouse anti‐autophagy related 7 (ATG7) (1:1000, 67341; Proteintech), and rabbit anti‐BECLIN1 (1:1000, 3495; CST). The secondary antibodies used were anti‐rabbit IgG (1:4000, CST; 7074) and anti‐mouse IgG (1:4000, CST; 7076). Protein bands were visualized using the Tanon Gel Imaging System (Tanon, China), and quantified using ImageJ software, with tubulin or actin serving as an internal reference.
Immunostaining
The cells or cochlear explants were fixed using 4% paraformaldehyde (P6148; Sigma‐Aldrich). The samples were permeabilized by incubation in PBST (PBS containing 1% Triton X‐100 (1231O021; Solarbio)) for 30 min, and blocking with 10% FBS (SL050; Solarbio) for 1 h, and incubated overnight at 4°C with appropriately diluted primary antibodies. After three 10‐min washes with PBST, the samples were incubated for 2 h at RT with appropriately diluted secondary antibodies. Nuclei were stained using DAPI (1:1000, C0065; Solarbio) before mounting. The primary antibodies used were as follows: rabbit anti‐NMNAT1 (1:400, 11399‐1‐AP; Proteintech), rabbit anti‐myosin7a (1:1000, 25‐6790; Proteus Bioscience), mouse anti‐myosin7a (1:400, 138‐1; DSHB), and rabbit anti‐γ‐H2A.X (1:400, 2577; CST). The secondary antibodies used were Alexa Fluor 555 donkey anti‐rabbit (1:400, Invitrogen, A‐31572), Alexa Fluor 488 donkey anti‐rabbit (1:400, Invitrogen, A‐21206), and Alexa Fluor 488 donkey anti‐mouse (1:400, Invitrogen, R37114). Fluorescence images were photographed using a confocal microscope (LSM900; ZEISS).
Semi‐Quantification of the Immunolabeling Signals From Outer Hair Cells () OHCs
Semi‐quantification of immunolabeled signals is a well‐accepted method (He, Pan, et al. 2021; Yuan et al. 2015). NMNAT1 immunolabeling in OHCs was semi‐quantified from confocal images captured with a × 63 lens under equal parameter settings. The fluorescence linear ranges of NMNAT1 were semi‐quantified using the ImageJ software (National Institutes of Health, Bethesda, MD, USA). Individual OHCs were outlined using the ImageJ circle tool based on myosin7a staining. NMNAT1 fluorescence in grayscale OHCs was measured, and background was subtracted. The average grayscale intensity of the NMNAT1 fluorescence was calculated for each OHC. The relative grayscale intensity was normalized to that of the control group.
Senescence‐Associated β‐Galactosidase (‐β‐Gal) Staining SA
Cellular Senescence β‐Galactosidase Staining Kit (C0602) was purchased from Beyotime (China). Cells and cochlear explants were exposed to D‐gal for 72 h, followed by removal of the culture medium and washing with PBS. Subsequently, added 1 mL β‐galactosidase staining fixative for 15 min at RT. The cells were aspirated and washed thrice with PBS or HBSS for 3 min each. Subsequently, 1 mL of staining solution was added, and the samples were incubated overnight at 37°C.
/Measurements NAD NADH +
NAD+/NADH levels were measured using an Enhanced NAD+/NADH Assay Kit (S0176S; Beyotime). The cell culture medium was aspirated and discarded, and added 200 μL of NAD+/NADH extract buffer per million cells. After cell lysis, the cell supernatant was collected. The samples were diluted 5‐fold with NAD+/NADH extract and transferred to a 96‐well plate to determine the total NAD+ and NADH levels. A 100 μL aliquot of the diluted sample was incubated at 60°C for 30 min to degrade NAD+. Subsequently, 20 μL of the extract buffer was added to measure the NADH levels. The NAD+ concentration was calculated as follows: [NAD+] = ([NAD+] + [NADH]) − [NADH].
Proteomics Analysis
Proteomic analysis was conducted in collaboration with LUMINGBIO (Shanghai, China). For sample preparation, HEI‐OC1 cells were exposed to D‐gal (20 mg/mL) for 72 h. Then, the cells were washed thrice with 10 mL PBS on ice, and after trypsin‐EDTA (25200072; Gibco) digestion, PBS was added to the cell suspension. Following centrifugation (4°C, 1000 × g, 5–10 min), the PBS was removed. The cell pellets were flash‐frozen in liquid nitrogen, and stored at −80°C until shipment on dry ice for proteomic analysis. For proteomic profiling, total proteins were extracted from the samples. An aliquot was reserved for protein quantification and quality control by SDS‐PAGE. The remaining portion was digested with trypsin and labeled using Tandem Mass Tag (TMT) reagents (Thermo Fisher Scientific). Equal amounts of each TMT‐labeled sample were combined and then fractionated by chromatography. The resulting peptides were analyzed by liquid chromatography–tandem mass spectrometry (LC–MS/MS) using an Easy‐nLC 1100 system (Thermo Scientific) coupled to an Orbitrap Fusion Lumos Tribrid mass spectrometer (Thermo Scientific). Raw data were processed with Proteome Discoverer 2.4 (Thermo Fisher Scientific), applying a false discovery rate (FDR) threshold of 0.01 at both the protein and peptide levels. Following quality control and preprocessing, we performed analyses at the expression and functional levels. Specifically, differentially expressed proteins were identified and subsequently subjected to Gene Ontology (GO) enrichment analysis, pathway analysis, and protein–protein interaction (PPI) network analysis. All identified proteins are listed in Table . S1
Nucleoplasmic Separation Assay
Nuclear and cytoplasmic protein extraction kits (Beyotime P0028) were purchased from Beyotime (Shanghai, China). HEI‐OC1 cells were washed with precooled PBS and collected using cell scrapers. Nucleoplasmic separation experiments were performed using the kit, following the manufacturer's protocol.
‐‐‐Cell Line Construction HBLV mCherry GFP LC3B
HBLV‐mCherry‐GFP‐LC3B lentivirus was obtained from HANBIO, China. HEI‐OC1 cells were infected with HBLV‐mCherry‐GFP‐LC3B lentivirus (multiplicity of infection = 10) at a density of 30%–40%. After 48 h, HEI‐OC1 cells were cultured in a medium containing puromycin (5 μg/mL) and screened for at least 48 h. When all the puromycin‐treated untransfected cells in the control group died, all remaining cells in the infected virus group were positive. Subsequently, a stably expressing mCherry‐GFP‐LC3B cell line was established. Autophagic flux was assessed by monitoring mCherry‐GFP‐LC3B expression. Green fluorescence protein (GFP) fluorescence is quenched in acidic environments. When the lysosomes fuse with the autophagosomes to form autolysosomes, GFP is quenched, whereas mCherry remains stable. Yellow puncta (GFP+ mCherry+) represent autophagosomes. Red puncta (GFP− mCherry+) indicate acidic autolysosomes formed after autophagosomes fuse with lysosomes (GFP signal is quenched). Alterations in the number of red spots or the red/yellow spot ratio are reliable indicators of autophagic flux.
Drug Treatment
HEI‐OC1 cells were exposed to 100 nM rapamycin (HY‐10219; MedChemExpress), an autophagy activator, for 12 or 24 h. Autophagy levels were assessed using western blotting. Additionally, autophagy levels were determined after treating the cells with 100 nM bafilomycin A1 (HY‐100558; MedChemExpress), an autophagy inhibitor that targets the late stage of autophagy, for 12 h.
Plasmid and.7m8‐Construction AAV2 Nmnat1
The recombinant adeno‐associated virus (AAV) vector pAAV‐CMV‐Nmnat1‐EGFP plasmid was generated by Tsingke Biotech (Beijing, China). It was transfected into cells by co‐incubating with Lipofectamine 2000 transfection reagent (11668027; Invitrogen). The AAV2.7m8‐Ctrl and AAV2.7m8‐Nmnat1 (containing pAAV‐CMV‐Nmnat1‐3xFLAG‐EF1‐GdGreen‐WPRE) were constructed by Hanbio Biotechnology. After culturing the cochlear explants for 12 h, they were infected with AAV2.7m8‐Ctrl and AAV2.7m8‐Nmnat1 at a titer of 5 × 10¹⁰ for 36 h. Subsequently, the explants were exposed to D‐gal for 72 h, followed by immunofluorescence analysis.
‐Cell Line Construction Nmnat1 KO
The HEI‐OC1‐Nmnat1‐KO cell line was generated using CRISPR/Cas9 technology in collaboration with EDITGENE (Guangzhou, China). Based on Nmnat1 gene sequence data, two single‐guide RNAs (sgRNAs) were designed at the 5′ end of the open reading frame. sgRNA 1 (5′→3′): gaacagcctgaggtgcatgt and sgRNA 2 (5′→3′): tgaggtgcatgttggtgatg. The efficiency of Nmnat1 knockout (KO) was verified using RT‐qPCR and western blot. The off‐target sites of sgRNA1 and sgRNA2 were predicted using the CCTop‐CRISRP/Cas9 target online prediction website. The design of primers targeting potential off‐target sites and off‐target efficiency was verified using PCR and q‐PCR. The PCR primer sequences for predicting the off‐target sites are as follows: Prkar1b‐forward (5′ → 3′): GAGTTGTCCAAAGTATGCAGTAGT, Prkar1b‐reverse (5′ → 3′): AGAGTACCTG CCTAGCCTATGT; WD repeat domain 92 (Wdr92)‐forward (5′ → 3′): AGGGTGTGGTAGGAGAGACTG, Wdr92‐reverse (5′ → 3′): GGCCCAGGCTAAAAACCTTC; basonuclin 2 (Bnc2)‐forward (5′ → 3′): AGCATTTCCCTTCCCAATAAGAGA, Bnc2‐reverse (5′ → 3′): TGTTCTGATTTGA CCAGAGATTTCG; predicted gene 4117 (Gm4117)‐forward (5′ → 3′): GGCCAAACCCTCCCATATCAA, Gm4117‐reverse (5′ → 3′): AAGAGAGGCGTGTTTTTCCCA; and Uhrf2‐forward (5′ → 3′): GCTAGGTCCACTCAGACACAC; Uhrf2‐reverse (5′ → 3′): GGAGAGAG GCTCAGGTCAGA. The q‐PCR primer sequences for predicting the off‐target sites are as follows: Prkar1b‐forward (5′ → 3′): GAGTTGTCCAAAGTATGCAGTAGT, Prkar1b‐reverse (5′ → 3′): AGAGTACCTG CCTAGCCTATGT; and Uhrf2‐forward (5′ → 3′): GCTAGGTCCACTCAGACACAC; Uhrf2‐reverse (5′ → 3′): GGAGAGAG GCTCAGGTCAGA.
Untargeted Metabolomics
Metabolomic analysis was conducted in collaboration with LUMINGBIO (Shanghai, China). For sample preparation, added 1 mL mixture (methanol: water, V: V = 4:1) to the samples in two portions and transferred to a glass vial. Subsequently, 200 μL of chloroform was added, followed by ultrasound treatment in an ice bath (500 W; 3 min, 6 s On, 4 s Off). The liquid was aspirated into centrifuge tubes, and subjected to ultrasound in an ice bath for 20 min before being stored overnight at −40°C. The samples were centrifuged at 12,000 × g for 10 min at 4°C, and 400 μL of the supernatant was collected, concentrated, and dried using a centrifugal concentrator. Then, 80 μL of methoxamine salt pyridine solution (15 mg/mL) was added, and the mixture was incubated for 60 min at 37°C. Then, equilibrated at RT for 30 min. Chromatographic separation was performed using a DB‐5MS capillary column (30 m × 0.25 mm × 0.25 μm, Agilent J&W Scientific, Folsom, CA, USA). High‐purity helium (≥ 99.999%) was used as the carrier gas at a flow rate of 1.0 mL/min. The injection port temperature is 260°C; injection volume, 1 μL, split less injection; and solvent delay, 5 min. Temperature program: initial column temperature, 60°C (maintained for 0.5 min); increase temperature at 8°C/min to 125°C; then to 210°C, followed by 15°C/min to 270°C; and 20°C/min to 305°C (maintained for 5 min). Mass spectrometric detection was performed using electron impact ion source at 70 eV, with the ion source temperatures at 230°C and quadrupole temperatures at 150°C. Full‐scan acquisition was conducted over the m/z range of 50–500. Biologically significant differential metabolites were identified, and the significance of the differences between groups was assessed using variable importance in projection (VIP) values and Student's t‐test. Metabolites with p value < 0.05 and VIP > 1 were considered indicative of significant differences. The raw data (list) of all individual metabolites in the supplemental information Table S2.
Statistical Analysis
Statistical analyses were performed using GraphPad Prism version 9. Western blot results are presented as the mean ± standard deviation (SD), and group comparisons were analyzed using a one‐sample t‐test. Immunofluorescence staining results are presented as the mean ± standard error of the mean. Student's t‐test was used to compare the number of γ‐H2A.X aggregation spots and myosin7a+ cells. Significance was determined based on the following thresholds: *p < 0.05, **p < 0.01, ***p < 0.001, and ****p < 0.0001, p value greater than 0.05 was considered not statistically significant.
Results
Establishment of Aging Model in‐Cells and Cochlear Explants Treated With D‐Gal HEI OC1
Natural aging is a gradual physiological process. To assess ARHL, an aging model was generated by treating HEI‐OC1 cells with various concentrations of D‐gal (2, 5, 10, 20, and 40 mg/mL) for 72 h. CCK‐8 assay showed that with an increase in D‐gal concentration, HEI‐OC1 cell viability gradually reduced (Figure 1A,B). Based on these results, HEI‐OC1 cells were treated with low (5 mg/mL) and high (20 mg/mL) concentrations of D‐gal to determine the levels of reactive oxygen species (ROS). Immunofluorescence staining and flow cytometry with MitoSOX and DCFH‐DA indicated increased levels of ROS in D‐gal‐treated HEI‐OC1 cells after 72 h (Figure 1C–J). Subsequently, aging‐related marker expression levels of SMP30, Lamin B1, γ‐H2A.X, P21, and P16 were detected in HEI‐OC1 cells exposed to different D‐gal concentrations (Matias et al. 2022; Shao et al. 2021; Lopez‐Otin et al. 2023). SMP30 and Lamin B1 were downregulated in HEI‐OC1 cells exposed to high concentrations of D‐gal. However, the expression levels of SMP30 and Lamin B1 increased abnormally after treatment with low D‐gal concentrations (Figure 1K,L,N,O, Figure S1A,B,D,E), indicating that low D‐gal levels may activate cellular self‐protection mechanisms. With the increasing concentration of D‐gal, the expression of γ‐H2A.X, P21, and P16 was increased gradually (Figure 1M,P, Figure S1C,F,G–I,K). Immunofluorescence staining revealed that the number of γ‐H2A.X aggregation spots in D‐gal‐treated HEI‐OC1 cells increased significantly (Figure S1J,L), consistent with the Western blotting results. Additionally, the SA‐β‐gal staining results revealed that cellular aging was obviously elevated in HEI‐OC1 cells treated with D‐gal (Figure S1M,N). These results indicate that treatment with 20 mg/mL D‐gal for 72 h effectively induces cellular aging in HEI‐OC1 cells, providing a robust model for studying aging.
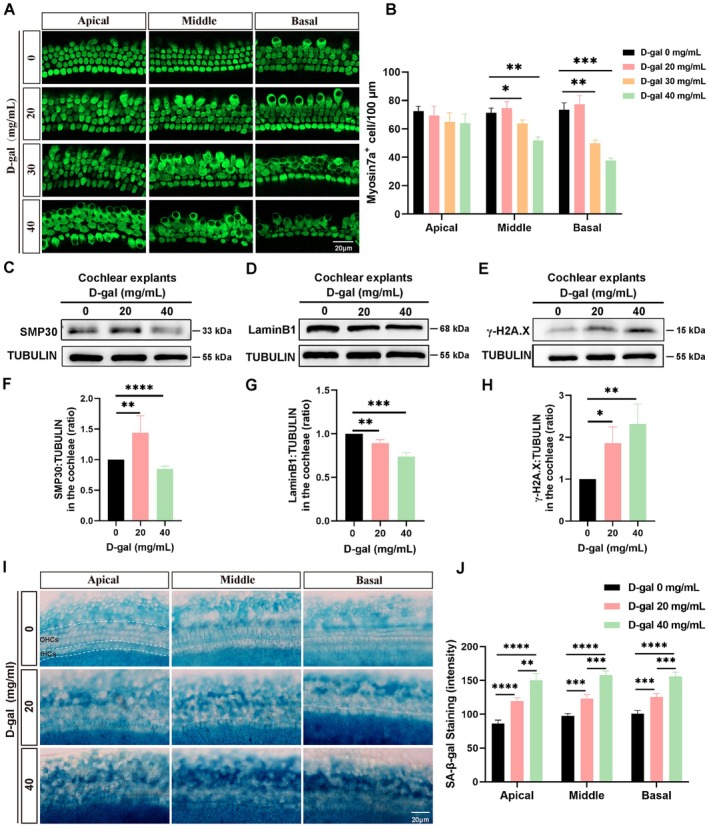
To establish a cochlear explant aging model, the cochlear basilar membrane was dissected from P3 mice and cultured in vitro. Based on a previous report (Guo et al. 2020), cochlear explants were exposed to various concentrations of D‐gal for 72 h. Cochlear explants were subjected to immunofluorescence staining for myosin7a—a marker of hair cells, revealing that no significant change in the number of myosin7a+ cells was observed in the low D‐gal concentration (20 mg/mL) group, indicating that low concentration (20 mg/mL) did not cause the loss of cochlear hair cells. However, the number of myosin7a+ cells in the high‐concentration D‐gal treatment group did not alter significantly in the apical region but reduced significantly in the middle and basal regions (Figure 2A,B), indicating that high concentration of D‐gal (40 mg/mL) induced an aging phenotype and caused cochlear hair cell damage. SMP30 was downregulated in cochlear explants exposed to high concentration of D‐gal (40 mg/mL), whereas it was abnormally upregulated after treatment with low D‐gal concentration (Figure 2C,F, Figure S2A,D). With an increase in D‐gal concentration, the expression level of Lamin B1 was reduced (Figure 2D,G, Figure S2B,E), whereas that of γ‐H2A.X, P21, and P16 were increased significantly (Figure 2E,H, Figure S2C,F,G–J). Additionally, SA‐β‐gal staining intensity was significantly upregulated in cochlear explants exposed to D‐gal (Figure 2I,J). These findings indicated that exposure to 40 mg/mL D‐gal for 72 h effectively induces aging in cochlear hair cells in vitro. D‐gal‐treated HEI‐OC1 cell and cochlear explant aging models offer a valuable framework for assessing the mechanisms of aging cochlear hair cell damage and developing potential therapeutic approaches for ARHL.

Establishment of D‐gal‐treated aging model in HEI‐OC1 cells. (A) Schematic illustration of D‐gal treatment in HEI‐OC1 cells. (B) Cell viability after exposure to different concentrations of D‐gal, evaluated using the CCK‐8 assay ( = 4, independent samples). (C) Immunofluorescent staining of Mito‐SOX in HEI‐OC1 cells exposed to D‐gal (5 and 20 mg/mL) for 72 h. (D) Quantitative analysis of Mito‐SOX intensity in C ( = 4, independent samples). (E) Mito‐SOX levels were detected using flow cytometry in HEI‐OC1 cells exposed to D‐gal (5 and 20 mg/mL) for 72 h. (F) Statistical analysis of Mito‐SOX levels in E ( = 3, independent samples). (G) Immunofluorescent staining of DCFH‐DA in HEI‐OC1 cells. (H) Quantitative analysis of DCFH‐DA intensity in G ( = 4, independent samples). (I) DCFH‐DA levels were detected using flow cytometry in HEI‐OC1 cells. (J) Statistical analysis of DCFH‐DA levels in I ( = 3, independent samples). (K–M) Western blot analysis of senescence marker protein‐30 (SMP30), Lamin B1, and γ‐H2A.X in HEI‐OC1 cells treated with D‐gal. (N–P) Statistical analysis of SMP30 ( = 4, independent samples), Lamin B1 ( = 3, independent samples), and γ‐H2A.X ( = 3, independent samples) expression in K–M. Scale bar: 20 μm. Statistical significance as ns, no significant difference, * < 0.05, ** < 0.01, *** < 0.001, and **** < 0.0001. n n n n n n n n p p p p

Establishment of D‐gal‐induced aging model in cochlear explants. (A) Immunofluorescence staining demonstrating the number of myosin7ahair cells in cochlear explants treated with 20, 30, and 40 mg/mL D‐gal for 72 h. (B) Quantification of the number of myosin7ahair cells in cochlear explants ( = 4; four individual explants from four mice). (C–E) Western blotting of senescence marker protein‐30 (SMP30), Lamin B1, and γ‐H2A.X expression in cochlear explants exposed to D‐gal. (F–H) Statistical analysis of SMP30 ( = 5), Lamin B1 ( = 3), and γ‐H2A.X ( = 3) in C–E;corresponds to the number of independent samples, each consisting of 12 explants from six mice. (I) Senescence‐associated β‐gal staining images of hair cells in cochlear explants exposed to D‐gal. (J) Quantification of β‐gal staining intensity in I ( = 4; four individual explants from four mice). Scale bar: 20 μm. Statistical significance is indicated as * < 0.05, ** < 0.01, *** < 0.001, and **** < 0.0001. + + n n n n n n p p p p
Expression Levels Were Reduced in Aging‐Cells and Cochlear Explants Treated With D‐Gal NMNAT1 HEI OC1
NAD+ levels are obviously decreased in the cochlear cells of aged mice (Okur et al. 2023). Additionally, we identified that NAD+ levels in HEI‐OC1 cells exposed to D‐gal (20 mg/mL) were significantly reduced (Figure 3A). Moreover, NAD+ levels were significantly reduced with an increase in D‐gal concentrations in the D‐gal‐treated cochlear explant aging model (Figure 3B). To assess alterations in gene expression in D‐gal‐induced aging cells, we used proteomics to detect protein expression in HEI‐OC1 cells exposed to 20 mg/mL D‐gal. The proteomic results revealed that NMNAT1 expression was significantly reduced in the D‐gal‐induced aging model (Figure 3C).
NMNAT1 is a core enzyme involved in NAD+ biosynthesis and is essential for maintaining cellular NAD+ levels. Alterations in NAD+ levels are associated with a reduced NMNAT1 expression. Human Nmnat1 is predominantly expressed in the nucleus (Lau et al. 2010); however, its localization in mice remains unclear. To determine the subcellular localization of NMNAT1 in mouse‐derived HEI‐OC1 cells, we performed a nucleoplasmic separation assay and observed that NMNAT1 was expressed in both the cytoplasm and nucleus, with a predominant localization in the nucleus (Figure S3A,B). Additionally, immunofluorescence staining revealed that NMNAT1 was expressed in the nucleus and cytoplasm of mouse cochlear hair cells (Figure S3C), consistent with the results of the nucleoplasmic separation assay.
To verify the proteomics results, we performed western blot and observed that NMNAT1 was slightly upregulated in HEI‐OC1 cells exposed to low concentration of D‐gal (5 mg/mL), but significantly downregulated at high concentration of D‐gal (20 mg/mL) (Figure 3D,E). Alterations in NMNAT1 expression were further confirmed in D‐gal‐exposed aging cochlear hair cells, with significantly reduced NMNAT1 levels in the high‐concentration D‐gal (40 mg/mL) treatment group (Figure 3F,G). These results indicate that NMNAT1 levels were significantly reduced in D‐gal‐treated aging HEI‐OC1 and cochlear hair cells.
To further confirm these findings, immunofluorescence staining revealed that NMNAT1 expression levels in cochlear OHCs in the apical, middle, and basal regions were significantly reduced in the high‐concentration D‐gal (40 mg/mL) group (Figure 3H,J,K,M,N,P). Specifically, the expression level of NMNAT1 in cochlear hair cells in the basal region gradually reduced with increasing D‐gal concentrations (Figure 3N,P), indicating that cochlear basal hair cells were more sensitive to D‐gal induction and more susceptible to damage. These results indicated that D‐gal induces cochlear hair cell damage and alters NMNAT1 expression in aging hair cells, supporting the potential role of NMNAT1 in aging hair cells.

NMNAT1 levels are decreased in D‐gal‐treated aging of HEI‐OC1 cells and cochlear explants. (A) NADlevels are significantly reduced in D‐gal treated HEI‐OC1 cells for 72 h ( = 3, independent samples). (B) NADlevels are significantly reduced in the D‐gal‐induced cochlear explant aging model ( = 4, independent samples, each consisting of 12 explants from six mice). (C) Results of proteomic analysis demonstrating the significant downregulation of NMNAT1 in the D‐gal‐induced aging model ( = 3, independent samples). (D) Western blotting of NMNAT1 expression in HEI‐OC1 cells exposed to D‐gal (5 and 20 mg/mL). (E) Statistical analysis of NMNAT1 expression in D ( = 5, independent samples). (F) Western blotting of NMNAT1 expression in cochlear explants exposed to D‐gal (40 mg/mL) for 72 h. (G) Quantification of NMNAT1 expression in F ( = 3, independent samples, each consisting of 12 explants from six mice). (H) Immunofluorescence staining demonstrating the number of myosin7ahair cells and NMNAT1 levels in 20 and 40 mg/mL D‐gal‐treated apical cochlear explants. (I) Statistical analysis demonstrating the number of myosin7ahair cells in the apical cochlear explants ( = 4; four individual explants from four mice). (J) Statistical analysis demonstrating NMNAT1 levels in outer hair cells (OHCs) in the apical cochlear explants ( = 4; four individual explants from four mice). (K) Immunofluorescence staining demonstrating the number of myosin7ahair cells and NMNAT1 levels in the middle cochlear explants. (L) Quantification of the number of myosin7ahair cells in the middle cochlear explants ( = 4; four individual explants from four mice). (M) Statistical analysis of NMNAT1 levels in OHCs in the middle cochlear explants ( = 4; four individual explants from four mice). (N) Immunofluorescence staining demonstrating the number of myosin7ahair cells and NMNAT1 levels in the basal cochlear explants. (O) Statistical analysis demonstrating the number of myosin7ahair cells in the basal cochlear explants ( = 4; four individual explants from four mice). (P) Statistical analysis demonstrating NMNAT1 levels in OHCs in the basal cochlear explants ( = 4; four individual explants from four mice). Scale bar: 20 μm. Statistical significance is indicated as * < 0.05, ** < 0.01, and *** < 0.001. + + + + + + + + n n n n n n n n n n n p p p
Autophagy Was Impaired in the D‐Gal‐Induced Aging Model, andOverexpression Activated Autophagy and Delayed Aging Nmnat1
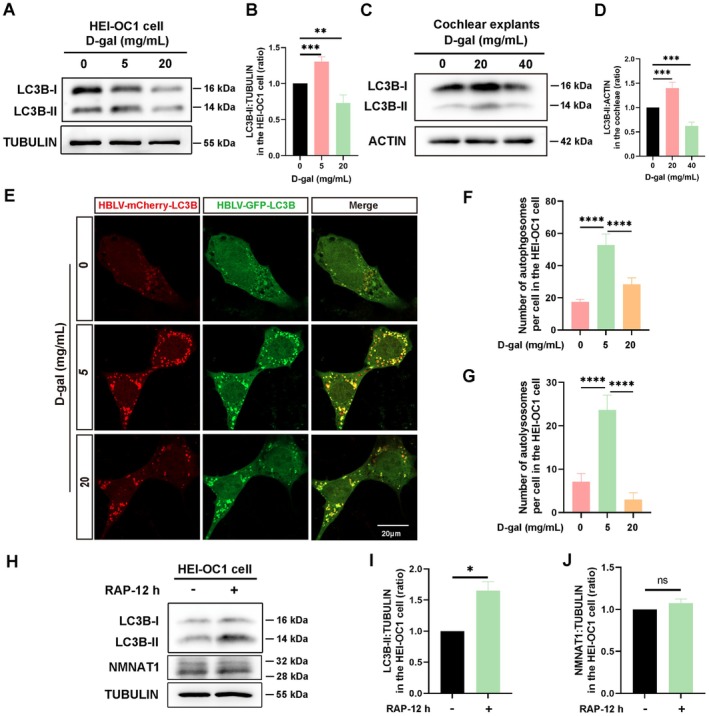
Autophagy levels gradually decline with age, and there is an association between autophagy dysfunction and aging (Aman et al. 2021; Kaushik et al. 2021; Wong et al. 2020). To assess whether autophagy levels were altered in the D‐gal‐induced aging model, we determined that LC3B‐II, ATG7, and BECLIN1 expression levels were increased after treatment with low D‐gal concentration (5 mg/mL) but were obviously reduced after exposure to high D‐gal concentration (20 mg/mL) in HEI‐OC1 cells (Figure 4A,B, Figure S4A,C,D,F,G,J). P62 expression levels gradually increased after exposure to D‐gal for 72 h (Figure S4B,E). Additionally, the expression levels of LC3B‐II, P62, ATG7, and BECLIN1 in D‐gal‐induced aging cochlear explants aligned with the results obtained from D‐gal‐treated aging of HEI‐OC1 cells (Figure 4C,D, Figure S4H,I,K–P). These results indicated that low D‐gal concentrations activate autophagy, whereas high concentrations suppress it.
To assess alterations in autophagy levels, HEI‐OC1 cells were infected with HBLV‐mCherry‐GFP‐LC3B lentivirus to establish a stable cell line. Western blot results confirmed that the expression of endogenous LC3B was not affected by exogenous mCherry‐GFP‐LC3B in the stable cell line (Figure S5F). Following D‐gal‐induced aging, autophagic flux was assessed by monitoring mCherry‐GFP‐LC3B expression. The number of yellow (autophagosomes) and red puncta (autolysosomes) significantly increased in cells treated with a low D‐gal concentration (5 mg/mL). In contrast, treatment with a high D‐gal concentration (20 mg/mL) significantly reduced both types of puncta compared with the low concentration group (Figure 4E–G). These results align with our previous findings (Wei et al. 2025), indicating that low D‐gal concentration activates autophagy, whereas high D‐gal concentration significantly impairs autophagic activity in aging HEI‐OC1 cells. These results indicate that autophagy was impaired in D‐gal‐induced aging of HEI‐OC1 cells and cochlear explants.
hNmnat1 Overexpression in AD facilitates autophagy and reduces amyloid plaques (Zhu et al. 2022). NMNAT1 activates autophagy by regulating the SIRT1/mTOR pathway in aged rats (Wang et al. 2019). To assess the relationship between NMNAT1 and autophagy in the D‐gal‐treated aging model, HEI‐OC1 cells were treated with 100 nM rapamycin for 12 h. Western blotting revealed a significant increase in LC3B‐II expression (Figure 3H,I). However, NMNAT1 expression was unaffected (Figure 4H–J). Similar results were obtained after rapamycin treatment for 24 h (Figure S5A–C). These results indicated that NMNAT1 expression was not affected by autophagic activation.
To confirm the role of NMNAT1 in autophagy regulation, NMNAT1 was overexpressed in HEI‐OC1 cells by transfection with the pAAV‐CMV‐Nmnat1‐EGFP plasmid for 12 h, followed by treatment with D‐gal (20 mg/mL) for 72 h. Subsequently, HEI‐OC1 cells were treated with bafilomycin A1 (100 nM) for 12 h before cell collection. Notably, western blotting revealed that Nmnat1 overexpression upregulated LC3B‐II (Figure 5A,B) and downregulated P62 (Figure 5A,C). However, BECLIN1 levels remained unaltered (Figure S5D,E). Compared with bafilomycin A1 treatment alone, combined treatment with Nmnat1 overexpression and bafilomycin A1 further increased LC3B‐II levels (Figure 5A,B) and slightly reduced P62 levels (Figure 5A,C). To further affirm these findings, autophagic flux was evaluated using mCherry‐GFP‐LC3B expression. Nmnat1 overexpression increased the number of yellow (autophagosomes) and red puncta (autolysosomes) in D‐gal‐induced aging HEI‐OC1 cells, and co‐treatment with bafilomycin A1 further enhanced their accumulation (Figure 5D–F). These findings indicated that Nmnat1 overexpression enhances autophagic flux and may modulate the aging process by regulating autophagy in the D‐gal‐induced aging model.
Autophagy activation in aging cochlear hair cells facilitates their survival (He, Li, et al. 2021). To confirm the effect of NMNAT1 on aging, HEI‐OC1 cells were transfected with the Nmnat1 plasmid for 12 h and then treated with D‐gal (20 mg/mL) for 72 h. Western blotting revealed that Lamin B1 was significantly upregulated in the NMNAT1 overexpression group compared to the D‐gal‐treated group alone (Figure 5G–I), whereas the expression level of γ‐H2A.X was significantly reduced (Figure 5G,J). These results demonstrate that Nmnat1 overexpression can delay D‐gal‐induced aging by activating autophagy.

D‐gal‐induced aging impairs autophagy in HEI‐OC1 cells and cochlear explants. (A) Western blotting of LC3B‐II expression in D‐gal treated HEI‐OC1 cells. (B) Statistical analysis of LC3B‐II expression in A ( = 4, independent samples). (C) Western blotting of LC3B‐II expression in D‐gal treated cochlear explants. (D) Quantitative analysis of LC3B‐II expression in C ( = 4, independent samples, each consisting of 12 explants from six mice). (E) Autophagic flux is assessed by monitoring mCherry‐GFP‐LC3B expression in D‐gal treated HEI‐OC1 cells. Immunofluorescence staining demonstrating the number of yellow (autophagosomes) and red puncta (autolysosomes). (F) Statistical analysis of the number of autophagosomes (yellow puncta) in E ( = 10; 10 cells from four independent samples). (G) Quantitative analysis of the number of autolysosomes (red puncta) in E ( = 10; 10 cells from four independent samples). (H) Western blotting of LC3B‐II and nicotinamide nucleotide adenylate transferase 1 (NMNAT1) expression in HEI‐OC1 cells exposed to 100 nM rapamycin for 12 h. (I) Quantification of LC3B‐II expression in H ( = 3, independent samples). (J) Statistical analysis of NMNAT1 expression in H ( = 3, independent samples). Scale bar: 20 μm. Statistical significance is indicated as * < 0.05, ** < 0.01, *** < 0.001, **** < 0.0001, and ns, no significant difference. n n n n n n p p p p

Overexpression ofactivates autophagy and delays aging in D‐gal‐treated HEI‐OC1 cells. (A) Western blot results of microtubule‐associated protein 1 light chain 3 beta (LC3B‐II) and P62 in‐overexpressing HEI‐OC1 cells exposed to D‐gal (20 mg/mL) for 72 h. The cells are exposed to 100 nM bafilomycin A1 for 12 h before collection. (B) Statistical analysis of LC3B‐II expression in A ( = 4, independent samples). (C) Statistical analysis of P62 expression in A ( = 3, independent samples). (D) Immunofluorescence staining demonstrating thatoverexpression significantly increased the number of yellow and red puncta in D‐gal‐treated aging HEI‐OC1 cells. (E) Statistical analysis of the number of autophagosomes (yellow puncta) in D ( = 14; 14 cells from four independent samples). (F) Statistical analysis of the number of autolysosomes (red puncta) in D ( = 14; 14 cells from four independent samples). (G) Western blotting of Lamin B1 and γ‐H2A.X expression in NMNAT1‐overexpressing HEI‐OC1 cells. (H) Statistical analysis of NMNAT1 expression in G ( = 3, independent samples). (I) Statistical analysis of lamin B1 expression in G ( = 3, independent samples). (J) Statistical analysis of γ‐H2A.X expression in G ( = 3, independent samples). Scale bar: 20 μm. Statistical significance is indicated as * < 0.05, ** < 0.01, *** < 0.001, and **** < 0.0001. Nmnat1 Nmnat1 n n Nmnat1 n n n n n p p p p
Overexpression ofIncreased Protected Cochlear Hair Cells From D‐Gal‐Induced Aging in Cochlear Explants In Vitro Nmnat1
To verify the role of NMNAT1 in cochlear hair cells, we constructed AAV2.7m8‐Nmnat1 virus. AAV2.7m8 is highly efficient in infecting cochlear hair cells (Isgrig et al. 2019). Cultured cochlear explants were infected with AAV2.7m8‐Nmnat1 in vitro for 36 h, followed by treatment with 40 mg/mL D‐gal for 72 h. Immunofluorescence staining revealed that the number of myosin7a+ hair cells was obviously decreased in the middle and basal turns of the D‐gal‐alone treatment group (Figure 6A–F). However, the number of myosin7a+ hair cells was higher in the middle and basal turns of the AAV2.7m8‐Nmnat1 and D‐gal treatment groups than that in the D‐gal‐alone treatment group (Figure 6A–F). These results indicate that Nmnat1 overexpression attenuates D‐gal‐treated cochlear hair cell damage and increases cochlear hair cell survival.

Overexpression ofby AAV2.7m8‐attenuated D‐gal–induced damage and enhanced hair cell survival. (A) Immunofluorescence staining demonstrating the number of myosin7ahair cells in AAV2.7m8‐‐infected and 40 mg/mL D‐gal‐treated apical cochlear explants. (B) Statistical analysis of the number of myosin7ahair cells in the apical cochlear explants ( = 4; four individual explants from four mice). (C) Immunofluorescence staining demonstrating the number of myosin7ahair cells in the middle cochlear explants. (D) Statistical analysis of myosin7ahair cells in the middle cochlear explants ( = 4; four individual explants from four mice). (E) Immunofluorescence staining demonstrating myosin7ahair cells in the basal cochlear explants. (F) Statistical analysis of myosin7ahair cells in the basal cochlear explants ( = 4; four individual explants from four mice). Scale bar: 20 μm. Statistical significance is indicated as *** < 0.001, **** < 0.0001, and ns, no significant difference. Nmnat1 Nmnat1 Nmnat1 n n n p p + + + + + +
Tricarboxylic Acid Cycle () Was Impaired in‐Cells TCA KO Nmnat1
NAD+ is a primary coenzyme in oxidation–reduction reactions, whereas NADH is the reduced form that is essential for maintaining energy metabolism and regulating various dehydrogenases involved in metabolic pathways (Verdin 2015; Ross 2021). To assess the biological function of Nmnat1 in HEI‐OC1 cells, we constructed an Nmnat1‐KO cell line using CRISPR/Cas9 technology in HEI‐OC1 cells. RT‐qPCR and western blot analyses indicated that Nmnat1 expression was successfully reduced at both the mRNA and protein levels in the Nmnat1‐KO cells (Figure S6A–C). To predict the potential off‐target sites of CRISPR/Cas9 technology, we predicted the off‐target sites of sgRNAs using the CCTop‐CRISRP/Cas9 target online predictor website (Figure S6D,E). Analysis of potential off‐target sites confirmed the absence of unintended editing by sgRNA1 and sgRNA2 in Nmnat1‐KO cell lines (Figure S6F–H). These results indicate that Nmnat1 was effectively knocked out without off‐target effects.
To assess the effects of NMNAT1 on cellular metabolic pathways, we determined the differential metabolite profiles of HEI‐OC1 and Nmnat1‐KO cells using untargeted metabolomics. Volcano plots revealed the differential expression of various metabolites in Nmnat1‐KO cells (Figure 7A). Pathway enrichment analysis revealed that multiple metabolic pathways were affected in Nmnat1‐KO cells, including amino acid and glucose metabolism (Figure 7B). Notably, the TCA cycle was disrupted in Nmnat1‐KO cells, with an abnormal accumulation of multiple TCA cycle intermediates, including citric acid, D‐threo‐isocitric acid, oxoglutaric acid, and malic acid (Figure 7B–E). The TCA cycle is the hub of intracellular material and energy metabolism (Martinez‐Reyes and Chandel 2020). The conversion of citric acid and D‐threo‐isocitric acid to oxoglutaric acid, oxoglutaric acid to succinyl coenzyme A, and malic acid to oxaloacetic acid requires NAD+ (Figure 7C). NMNAT1 is the primary rate‐limiting enzyme in NAD+ biosynthesis, and its deletion blocks NAD+ synthesis, disrupting the TCA cycle and causing the accumulation of citric acid, D‐threo‐isocitric acid, oxoglutaric acid, and malic acid owing to impaired subsequent metabolism (Figure 7F–I). These results revealed a significant regulatory role of NMNAT1 in cellular metabolism.

Metabolomic analysis demonstrating impaired tricarboxylic acid cycle (TCA) metabolism incells. (A) Volcano plots demonstrating the differential expression of various metabolites in‐KO cells. (B) Bubble map of Kyoto Encyclopedia of Genes and Genomes enrichment analysis of signaling pathways associated with metabolism. (C) Schematic illustration of the TCA metabolism. (D) Heatmap demonstrating the differential expression of various metabolites in‐KO cells. (E) Lollipop map demonstrating the metabolites and their log2 (Fold Change) values. (F–I) Boxplot demonstrating the relative expression levels of citric acid, D‐threo‐isocitric acid, oxoglutaric acid, and malic acid in‐KO cells ( = 6, independent samples). Statistical significance is indicated as ** < 0.01 and *** < 0.001. Nmnat1‐KO Nmnat1 Nmnat1 Nmnat1 n p p
Discussion
Current research on ARHL is limited because of its complex etiology. D‐gal is a reducing sugar that is typically metabolized to glucose at physiological concentrations. However, its accumulation at high concentrations disrupts cellular metabolism and increases cellular osmolality and ROS production, thereby facilitating aging. This accumulation induces pathological alterations that closely resemble those of natural aging (Guo et al. 2020; Aman et al. 2021; Saleh et al. 2019). Therefore, D‐gal is commonly used to establish aging models.
In this study, we observed that the levels of aging markers SMP30 (Figure 1K,N, Figure S1A,D) and Lamin B1 (Figure 1L,O, Figure S1B,E) were abnormally increased in HEI‐OC1 cells exposed to low (5 mg/mL) D‐gal concentrations, along with an increase in NAD+ levels (Figure 3A) and autophagy (Figure 4A, Figure S4A,D). These alterations differed from typical aging cell profiles, indicating that low‐concentration D‐gal treatment may activate a cellular self‐protection mechanism in HEI‐OC1 cells, thereby increasing autophagy levels. Our findings align with the report by He, Li, et al. (2021), which reported enhanced autophagy in HEI‐OC1 cells exposed to low concentration of D‐gal. Additionally, we observed that NMNAT1 was upregulated in the D‐gal‐treated aging model at low D‐gal concentrations, whereas it was significantly downregulated at high D‐gal concentrations (Figure 3D,E). This aligns with the alterations in NAD+ and autophagy levels, indicating that low D‐gal concentrations may trigger self‐protective responses in HEI‐OC1 cells by activating NMNAT1 and associated signaling pathways to facilitate cell survival. In contrast, a high D‐gal concentration diminished these protective mechanisms.
The NMNAT family of proteins—that forms a primary enzyme group catalyzing NAD+ biosynthesis—comprises three primary isoforms distinguished by their subcellular localization: NMNAT1, NMNAT2, and NMNAT3 localized in the nucleus, Golgi, and mitochondria in humans, respectively (Lau et al. 2010; Jayaram et al. 2011). hNMNAT1 localizes to the nucleus of human cells, as confirmed by the expression of recombinant proteins in Escherichia coli (Schweiger et al. 2001). However, NMNAT1 localization in mouse cells remains unclear. In this study, immunofluorescence staining of NMNAT1 in cochlear hair cells demonstrated predominant nuclear localization, with additional cytoplasmic expression (Figure S3C). To confirm NMNAT1 localization in HEI‐OC1 cells, we determined its expression in the nuclear and cytoplasmic fractions. Although NMNAT1 was detected in both fractions, its levels were higher in the nuclear fraction (Figure S3A,B). Additionally, cytoplasmic Nmnat1 overexpression in retinal ganglion cells and axons of transgenic mice enhanced the survival of these cells (Zhu et al. 2013). These findings indicate that although NMNAT1 is predominantly nuclear, its cytoplasmic expression may play a significant role, requiring further assessment.
NAD+ levels decline with age. As a central metabolic cofactor, NAD+ regulates numerous metabolic pathways and fluxes (Covarrubias et al. 2021; Verdin 2015). Therefore, maintaining NAD+ homeostasis is essential for preventing age‐related metabolic dysfunctions. Interventions that modulate NAD+ levels or supplement NAD+ precursors have demonstrated promise in alleviating metabolic disorders, including abnormalities in glucose and lipid metabolism (Tarrago et al. 2018; Yoshino et al. 2011). In this study, NMNAT1 deletion disrupted the TCA cycle (Figure 7B–I) and significantly reduced glucose, fructose, mannose, and galactose metabolism (Figure 7B,D). This likely resulted from impaired NAD+ synthesis because of NMNAT1 deficiency, indicating the crucial regulatory role of NMNAT1 in cellular metabolism. Although NMNAT1 expression is widely reported to regulate cellular NAD+ levels, a study on AD revealed that NMNAT1 overexpression enhances NMNAT enzymatic activity without altering NAD+ levels (Rossi et al. 2018). A negative feedback mechanism has been hypothesized to maintain NAD+ homeostasis under these conditions. Recent studies have increasingly highlighted the association between autophagy dysfunction and aging. Autophagy and cellular metabolic functions decline with age (Wong et al. 2020). Autophagy initiation and activation are energy‐intensive processes that are affected by nutrient availability and external signals. Dysregulation of glucose and cholesterol affects the mTOR and AMP‐activated protein kinase signaling pathways, impairing autophagy, and promoting aging (Castellano et al. 2017; Wolfson et al. 2017; Zhou et al. 2017). In contrast, autophagy sustains cellular metabolic homeostasis under nutrient‐limited conditions by providing precursors for anabolism and energy metabolism. During starvation, the autophagic breakdown of adipose tissue and muscle helps maintain blood glucose levels and provides glucose and ketone bodies to support neuronal metabolism in the brain (Khawar et al. 2019; Lin et al. 2021; Yang et al. 2019).
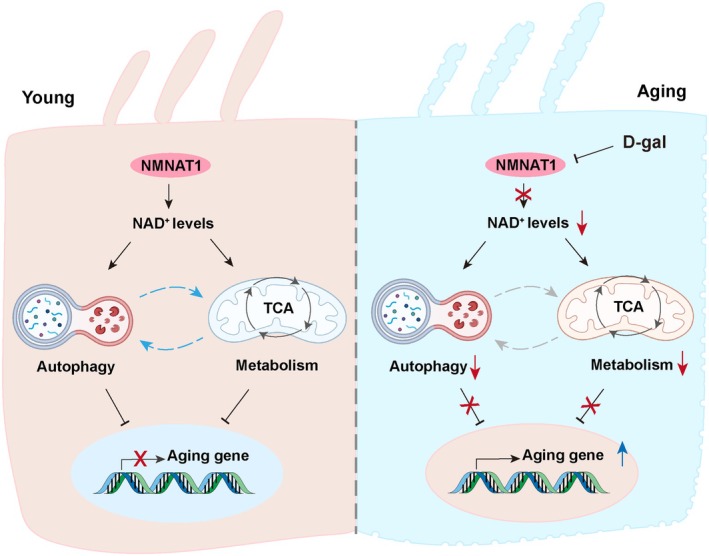
However, the interplay between autophagy and metabolism during aging requires further assessment. In this study, we observed reduced autophagy levels and downregulation of NMNAT1 in a D‐gal‐induced aging model, with NMNAT1 overexpression resulting in the activation of autophagy and potentially delaying aging. Additionally, NMNAT1 deletion disrupted the TCA cycle and pentose phosphate pathway (Figure 8). Therefore, our findings offer compelling evidence for the interplay between autophagy and cellular metabolism during aging, identifying potential targets for the diagnosis and treatment of ARHL. However, the mechanisms by which NMNAT1 regulates autophagy and metabolism during aging remain unclear.

Schematic illustration of the protective role of NMNAT1 during aging. NMNAT1 suppresses the expression of aging‐related genes by facilitating NADsynthesis, enhancing autophagy, and supporting tricarboxylic acid (TCA) cycle metabolism in young cochlear hair cells. In contrast, D‐galactose (D‐gal) treatment downregulates NMNAT1, thereby impairing autophagy and TCA cycle activity that subsequently facilitates the expression of aging‐related genes in D‐gal‐induced aging hair cells. +
Author Contributions
Yongjie Wei, Wenqing Yang, Han Wu, and Mengdie Kong have contributed equally as first authors to this work. Ye Zhang, Wei Cao, Jianming Yang, and Qiaojun Fang have made substantial contributions to conception, design, funding acquisition, supervision, and writing review and editing. Yongjie Wei, Wenqing Yang, Han Wu, and Mengdie Kong have performed project administration, investigation (execution of most experiments), visualization (figure organization), and writing – original draft preparation, review, and editing. Dachuan Fan, Yuhua Zhang, and Nan Cheng undertook the explants culture, data collection, data curation, and formal analysis. Jiawei Du and Lingna Guo helped with formal analysis, validation, review and editing. Yuyang Li has performed key supplementary experiments. Qian Dai helped perform supplementary experiments and revised the manuscript.
Funding
The authors have nothing to report.
Conflicts of Interest
The authors declare no conflicts of interest.