
What this is
- This observational study assessed the safety and effectiveness of the BNT162b2 COVID-19 vaccine in children and adolescents in England.
- It included data from over 820,000 adolescents aged 12-15 years and children aged 5-11 years, comparing vaccinated individuals to unvaccinated controls.
- Outcomes measured included COVID-19-related hospitalizations, emergency attendances, and safety events like myocarditis and pericarditis.
Essence
- BNT162b2 vaccination in adolescents reduced COVID-19 attendance and hospitalization, but protection against positive SARS-CoV-2 tests waned by 14 weeks.
Key takeaways
- Vaccination reduced positive SARS-CoV-2 tests ( 0.74) and COVID-19 attendance ( 0.60) in adolescents compared to unvaccinated individuals.
- After the second dose, the vaccine maintained some effectiveness ( 0.67) against positive SARS-CoV-2 tests but had no impact on attendance.
- Myocarditis and pericarditis were documented only among vaccinated individuals, with rates of 27 and 10 cases/million after the first and second doses, respectively.
Caveats
- Positive SARS-CoV-2 test data may underestimate actual infection rates due to unrecorded cases, impacting the perceived effectiveness of vaccination.
- Myocarditis and pericarditis rates may reflect ascertainment bias, as diagnostic thresholds could differ between vaccinated and unvaccinated individuals.
- The study excluded clinically vulnerable children, limiting the generalizability of findings to this population.
Definitions
- IRR (Incidence Rate Ratio): A measure comparing the incidence rates of events between two groups, indicating relative risk.
- A&E (Accident and Emergency): A medical facility providing immediate treatment for urgent health issues.
Simplified
METHODS
Data Source
We linked, stored, and analyzed all data securely using the OpenSAFELY platform,, as part of the National Health Service England OpenSAFELY COVID-19 service. Data include pseudonymized data such as coded diagnoses, medications, and physiologic parameters. No free text data was included. All code is shared openly for review and re-use under the MIT open license (). Detailed pseudonymized patient data is potentially reidentifiable and therefore not shared. Primary care records managed by the general practitioner software provider TPP were linked to ONS death data through OpenSAFELY. https://www.opensafely.org/↗ https://github.com/opensafely/vaccine-effectiveness-in-kids↗
Eligibility Criteria, Vaccination Groups, and Matching
We included (1) all adolescents aged 12–15 years and (2) all children aged 5–11 years on 31 August 2021, when age-based vaccine eligibility criteria were defined, who were not considered clinically vulnerable, as defined by the Joint Committee on Vaccination and Immunisation (clinically vulnerable individuals are those with certain chronic conditions—such as chronic respiratory, heart or neurological disease, or immunosuppressive conditions or medications—who were eligible for vaccination before the start of the study entry period); had been continuously registered at a general practitioner practice using TPP's SystmOne clinical information system for 42 days; had no evidence of SARS-CoV-2 infection or COVID-19 disease within the 30 days before vaccination; and had complete information on sex, deprivation, ethnicity, and National Health Service region.
Using a matched sequential trials design, we estimated the effectiveness and safety of: (1) the first vaccine dose versus no vaccination and (2) a second dose versus a single dose only. For the first vaccine dose, on each day of the study period, we emulated a trial such that each eligible individual vaccinated with their first dose was matched 1:1 without replacement with an eligible individual who had not yet been vaccinated. If multiple matches were available, the match was selected at random. We matched unvaccinated individuals to at most one vaccinated individual, but were eligible for inclusion in the vaccination group later on if they were subsequently vaccinated. We excluded from the analysis unvaccinated people who were not matched at any point. Follow-up of the vaccinated group included the time after the second vaccination. We pooled vaccinated and unvaccinated groups from each trial, respectively, for analysis. We used the same approach to assess the effectiveness and safety of a second vaccine dose, among individuals who had received a first vaccine dose.
Matching criteria were: age within year on 31 August 2021 (i.e., in the same school-year), sex (male/female), region, deprivation (as defined by Index of Multiple Deprivation quintile), evidence of prior infection (yes/no), prior tests in the preceding 26 weeks (0, 1–2, 3+), prior non-COVID childhood vaccination (measles/mumps/rubella: yes/no), and all other childhood vaccines(yes/no) and, for the second dose comparison, first vaccination date within 7 days. 10
Outcomes
We considered five effectiveness outcomes: positive SARS-CoV-2 test, COVID-19 accident and emergency (A&E) attendance, COVID-19 hospitalization, COVID-19 critical care admission, and COVID-19 death. Freely-available community testing for COVID-19 ended on 31 March 2022, and as non-high-risk children became eligible for vaccination in April 2022, the positive SARS-CoV-2 test was not considered for children (age 5–11 years). Non-COVID-19 death, fractures, and effectiveness in the first week after vaccination were considered as negative control outcomes (eBox 2;).We also considered A&E attendance, unplanned hospitalization, pericarditis, and myocarditis as safety endpoints (eBox 1;). Outcomes are described in eBoxes 1 and 2;. https://links.lww.com/EDE/C271↗ https://links.lww.com/EDE/C271↗ https://links.lww.com/EDE/C271↗ 11
Follow-up
Each individual was followed from assignment to a comparison group ("time zero") until the earliest of: end of freely-available community testing (positive SARS-CoV-2 test only), outcome, death, practice deregistration, or 20 weeks. Additionally, both members of the matched pair were censored if the matched control was vaccinated (i.e., first dose vaccination of the unvaccinated control in the first dose analysis, or second dose vaccination of the single-dose-only control in the second dose analysis), to ensure follow-up is not systematically longer in the vaccinated group.
Statistical Analysis
We estimated the cumulative incidence of events using the Kaplan–Meier estimator. We derived confidence intervals (CIs) using complementary log–log standard errors.
We also estimated period-specific incidence rates in each treatment group (number of events divided by person-time at risk), derived incidence rate ratios (IRRs), and their 95% CIs using Greenwood's formula on the log-IRR scale. We also present vaccine effectiveness as a percentage, defined as 100 * (1 − IRR). We also derived 20-week risk differences and corresponding 95% CIs from the sum of squares of Greenwood standard errors.
We estimated effectiveness separately according to whether there was evidence of prior SARS-CoV-2 infection (eTables 1–4;). https://links.lww.com/EDE/C271↗
Software, Code, and Reproducibility
Data management and analyses were conducted in Python version 3.8.10 (CreateSpace, Scotts Valley, CA) and R version 4.0.5 (R Foundation for Statistical Computing, Vienna, Austria). Code for data management and analysis, as well as codelists, is archived online. https://github.com/opensafely/vaccine-effectiveness-in-kids↗
Disclosure Control
We redacted any reported figures based on counts below 8. Cumulative incidence plots are not reported for outcomes with fewer than 30 outcomes. To reduce reidentification risk, counts are reported to the nearest n * 6 − 3 (3, 9, 15, 21, …). All derived statistics are based on these rounded counts, including cumulative incidence curves, which are based on rounded numbers-at-risk and event counts.
RESULTS
Adolescents
Of 513,192 eligible adolescents who were registered at a TPP practice and received a BNT162b2 vaccination during the study period, 410,463 (80%) were matched with unvaccinated controls. (eFigure 1;). Also, 220,929 (81%) of 271,440 eligible adolescents who received a second BNT162b2 vaccination were matched with single-vaccinated controls (eFigure 1;). https://links.lww.com/EDE/C271↗ https://links.lww.com/EDE/C271↗
As expected, the matching factors, other than age, were identically distributed in the vaccinated and control groups at the start of follow-up for all of the study populations (Table). Over 60% of adolescents in the first vaccination group received a second vaccination (eFigure 2;). Most second vaccinations occurred at least 12 weeks after the first vaccination (eFigure 2;). 1 https://links.lww.com/EDE/C271↗ https://links.lww.com/EDE/C271↗
| Adolescents | Children | |||||||
|---|---|---|---|---|---|---|---|---|
| First Dose vs. Unvaccinated | Second Dose vs. Single Dose Only | First Dose vs. Unvaccinated | Second Dose vs. Single Dose Only | |||||
| First Dose (n = 410,463) | Unvaccinated (n = 410,463) | Second Dose (n = 220,929) | Single Dose Only (n = 220,929) | First Dose (n = 141,711) | Unvaccinated (n = 141,711) | Second Dose (n = 66,231) | Single Dose Only (n = 66,231) | |
| Age | ||||||||
| 5 | - | - | - | - | 3,537 (2.5) | 2,457 (1.7) | 237 (0.4) | 153 (0.2) |
| 6 | - | - | - | - | 13,887 (9.8) | 13,905 (9.8) | 5,859 (8.8) | 5,811 (8.8) |
| 7 | - | - | - | - | 15,837 (11.2) | 15,591 (11.0) | 6,909 (10.4) | 6,843 (10.3) |
| 8 | - | - | - | - | 17,865 (12.6) | 18,435 (13.0) | 8,181 (12.4) | 8,187 (12.4) |
| 9 | - | - | - | - | 22,497 (15.9) | 21,759 (15.4) | 10,329 (15.6) | 10,293 (15.5) |
| 10 | - | - | - | - | 26,505 (18.7) | 26,187 (18.5) | 12,639 (19.1) | 12,633 (19.1) |
| 11 | - | - | - | - | 37,311 (26.3) | 31,473 (22.2) | 15,855 (23.9) | 15,783 (23.8) |
| 12 | 79,083 (19.3) | 78,669 (19.2) | 28,353 (12.8) | 25,401 (11.5) | 4,275 (3.0) | 11,901 (8.4) | 6,219 (9.4) | 6,531 (9.9) |
| 13 | 103,227 (25.1) | 104,391 (25.4) | 54,291 (24.6) | 55,527 (25.1) | - | - | 3 (0.0) | 0 (0.0) |
| 14 | 103,773 (25.3) | 103,527 (25.2) | 56,595 (25.6) | 56,829 (25.7) | - | - | - | - |
| 15 | 104,895 (25.6) | 105,753 (25.8) | 56,685 (25.7) | 59,901 (27.1) | - | - | - | - |
| 16 | 19,485 (4.7) | 18,123 (4.4) | 24,999 (11.3) | 23,265 (10.5) | - | - | - | - |
| Sex | ||||||||
| Female | 205,173 (50.0) | 205,173 (50.0) | 110,121 (49.8) | 110,121 (49.8) | 70,611 (49.8) | 70,611 (49.8) | 33,159 (50.1) | 33,159 (50.1) |
| Male | 205,287 (50.0) | 205,287 (50.0) | 110,805 (50.2) | 110,805 (50.2) | 71,103 (50.2) | 71,103 (50.2) | 33,075 (49.9) | 33,075 (49.9) |
| Deprivation | ||||||||
| 1 (most deprived) | 70,947 (17.3) | 70,947 (17.3) | 31,419 (14.2) | 31,419 (14.2) | 20,103 (14.2) | 20,103 (14.2) | 8,421 (12.7) | 8,421 (12.7) |
| 2 | 72,831 (17.7) | 72,831 (17.7) | 36,057 (16.3) | 36,057 (16.3) | 23,577 (16.6) | 23,577 (16.6) | 10,395 (15.7) | 10,395 (15.7) |
| 3 | 84,081 (20.5) | 84,081 (20.5) | 45,417 (20.6) | 45,417 (20.6) | 29,253 (20.6) | 29,253 (20.6) | 13,473 (20.3) | 13,473 (20.3) |
| 4 | 87,891 (21.4) | 87,891 (21.4) | 50,307 (22.8) | 50,307 (22.8) | 32,103 (22.7) | 32,103 (22.7) | 15,435 (23.3) | 15,435 (23.3) |
| 5 (least deprived) | 94,707 (23.1) | 94,707 (23.1) | 57,723 (26.1) | 57,723 (26.1) | 36,675 (25.9) | 36,675 (25.9) | 18,513 (28.0) | 18,513 (28.0) |
| Region | ||||||||
| East of England | 99,471 (24.2) | 99,471 (24.2) | 55,581 (25.2) | 55,581 (25.2) | 35,019 (24.7) | 35,019 (24.7) | 17,493 (26.4) | 17,493 (26.4) |
| London | 18,519 (4.5) | 18,519 (4.5) | 8,697 (3.9) | 8,697 (3.9) | 6,147 (4.3) | 6,147 (4.3) | 2,271 (3.4) | 2,271 (3.4) |
| Midlands | 90,093 (21.9) | 90,093 (21.9) | 50,601 (22.9) | 50,601 (22.9) | 31,497 (22.2) | 31,497 (22.2) | 14,931 (22.5) | 14,931 (22.5) |
| North East and Yorkshire | 78,471 (19.1) | 78,471 (19.1) | 41,061 (18.6) | 41,061 (18.6) | 24,105 (17.0) | 24,105 (17.0) | 11,853 (17.9) | 11,853 (17.9) |
| North West | 36,057 (8.8) | 36,057 (8.8) | 18,333 (8.3) | 18,333 (8.3) | 10,005 (7.1) | 10,005 (7.1) | 3,981 (6.0) | 3,981 (6.0) |
| South East | 26,511 (6.5) | 26,511 (6.5) | 14,571 (6.6) | 14,571 (6.6) | 9,651 (6.8) | 9,651 (6.8) | 4,059 (6.1) | 4,059 (6.1) |
| South West | 61,335 (14.9) | 61,335 (14.9) | 32,079 (14.5) | 32,079 (14.5) | 25,275 (17.8) | 25,275 (17.8) | 11,637 (17.6) | 11,637 (17.6) |
| Number of SARS-CoV-2 tests | ||||||||
| 0 | 85,515 (20.8) | 85,515 (20.8) | 39,795 (18.0) | 39,795 (18.0) | 52,503 (37.0) | 52,503 (37.0) | 48,969 (73.9) | 48,969 (73.9) |
| 1–2 | 108,261 (26.4) | 108,261 (26.4) | 62,487 (28.3) | 62,487 (28.3) | 51,897 (36.6) | 51,897 (36.6) | 9,963 (15.0) | 9,963 (15.0) |
| 3+ | 216,681 (52.8) | 216,681 (52.8) | 118,647 (53.7) | 118,647 (53.7) | 37,311 (26.3) | 37,311 (26.3) | 7,299 (11.0) | 7,299 (11.0) |
| Prior documented SARS-CoV-2 infection | 82,137 (20.0) | 82,137 (20.0) | 50,007 (22.6) | 50,007 (22.6) | 65,307 (46.1) | 65,307 (46.1) | 30,777 (46.5) | 30,777 (46.5) |
Effectiveness of the First Dose in Adolescents
In 95,641 person-years of potential follow-up from 820,926 adolescents, there were 56,496 positive SARS-CoV-2 tests; 72 COVID-19 A&E attendances; 90 COVID-19 hospitalizations, of which three included admission to critical care; and no COVID-19 deaths. There were three non-COVID-19-related deaths; 3444 fractures; 22,764 A&E attendances; 2664 unplanned hospitalizations; nine cases of pericarditis; and three cases of myocarditis. All pericarditis and myocarditis events occurred in the first dose group, while all COVID-19-related critical care admissions were in the unvaccinated group. Further analyses were restricted to positive SARS-CoV-2 tests, COVID-19 A&E attendance, COVID-19 hospitalization, fractures, A&E attendance, and unplanned hospitalization.
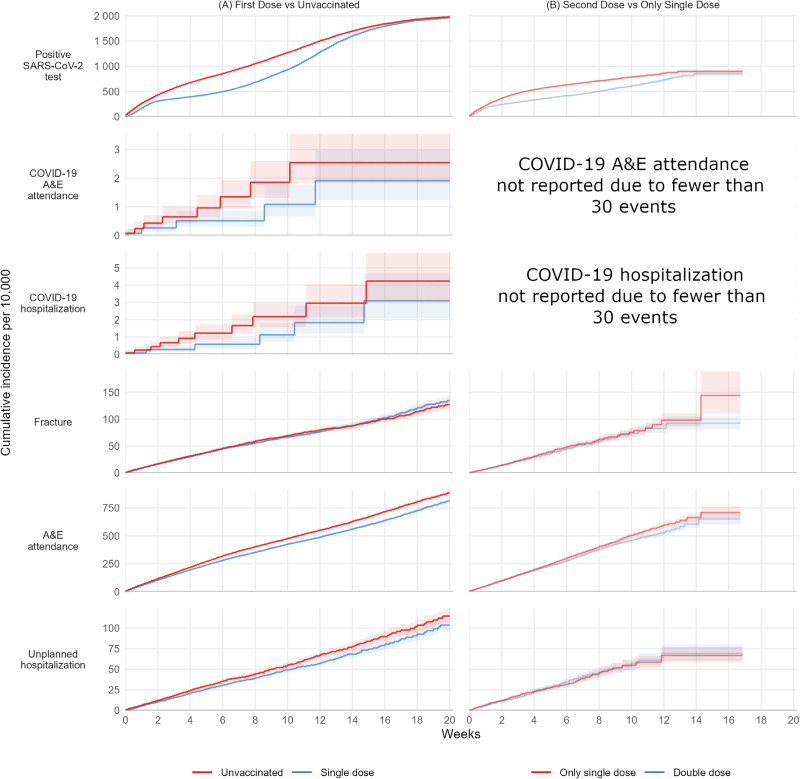
The rate of increase in the cumulative incidence of positive SARS-CoV-2 test after the first vaccine dose in adolescents declined substantially between 10 days and 6 weeks after vaccination, then increased (Figure). By 15 weeks, the cumulative incidence of positive SARS-CoV-2 tests was similar in the first-dose and unvaccinated groups. The 20-week risks per 10,000 were 1,961 (95% CI: 1,932, 1,990) and 1,979 (1,950, 2,008) in the vaccinated and unvaccinated groups, respectively. The IRR comparing vaccinated with unvaccinated adolescents was 0.74 (95% CI: 0.72, 0.75) and the vaccine effectiveness was 26.3 (25.1, 27.5) (Table). 1 2
The incidence of COVID-19 A&E attendance was lower after the first vaccination than in the unvaccinated group (IRR: 0.60; 95% CI: 0.37, 0.97), and the vaccine effectiveness was 40.0 (3.3, 62.7). The 20-week risks per 10,000 were 1.91 (95% CI: 1.23, 2.98) and 2.54 (1.83, 3.54), respectively. The incidence of COVID-19 hospitalization was lower after the first vaccination than in the unvaccinated group (IRR: 0.58; 0.38, 0.89), and the vaccine effectiveness was 43.1 (11.1, 62.3). The 20-week risks per 10,000 were 3.09 (2.05, 4.67) and 4.23 (3.05, 5.87), respectively.
The incidence of fractures (negative control outcome) was similar in the first vaccination and unvaccinated groups (IRR: 0.99; 95% CI: 0.93, 1.06), and the vaccine effectiveness was 1.0 (−5.8, 7.4). The 20-week risks per 10,000 were 135 (95% CI: 126, 144) in the single-dose group and 127 (119, 136) in the unvaccinated group. The incidence of A&E attendance (safety outcome) was lower after the first vaccination than in the unvaccinated group (IRR: 0.89; 0.87, 0.91), and the vaccine effectiveness was 10.9 (8.6, 13.2). The 20-week risks per 10,000 were 812 (95% CI: 792, 834) in the single-dose group and 885 (864, 907) in the unvaccinated group. The incidence of unplanned hospitalization was lower after the first vaccination than in the unvaccinated group (IRR: 0.88; 0.81, 0.95), and the vaccine effectiveness was 12.3 (5.4, 18.7). The 20-week risks per 10,000 were 104 (96, 112) in the single-dose group and 115 (107, 123) in the unvaccinated group.

Kaplan–Meier estimates of cumulative incidence of outcomes in adolescents.
| Outcome | Events/Person-Years | 20-Week Risk/10,000 (95% CI) | Events/Person-Years | 20-Week Risk/10,000 (95% CI) | RD per 10,000 people (95% CI) | IRR (95% CI) | VE (95% CI) |
|---|---|---|---|---|---|---|---|
| First Dose vs. Unvaccinated (n = 410,463 per Group) | |||||||
| First Dose | Unvaccinated | ||||||
| Positive SARS-CoV-2 test | 25,287/45,064 | 1,961 (1,932-1,990) | 31,209/40,990 | 1,979 (1,950, 2,008) | −18 (−59, 23) | 0.74 (0.72, 0.75) | 26.30 (25.10, 27.50) |
| COVID-19 A&E attendance | 27/47,801 | 1.91 (1.23, 2.98) | 45/47,827 | 2.54 (1.83, 3.54) | −0.63 (−1.83, 0.56) | 0.60 (0.37, 0.97) | 40.00 (3.30, 62.70) |
| COVID-19 hospitalization | 33/47,799 | 3.09 (2.05, 4.67) | 57/47,826 | 4.23 (3.05, 5.87) | −1.14 (−3.02, 0.74) | 0.58 (0.38, 0.89) | 42.10 (11.10, 62.30) |
| COVID-19 critical care | 0/47,804 | - | 3/47,837 | 0.24 (0.08, 0.76) | −0.24 (−0.52, 0.03) | - | - |
| COVID-19 death | 0/47,804 | - | 0/47,837 | - | - | - | - |
| Non-COVID-19 death | 3/47,804 | 0.51 (0.16, 1.58) | 0/47,837 | - | 0.51 (−0.07, 1.09) | - | - |
| Fracture | 1,713/47,624 | 135 (126, 144) | 1,731/47,633 | 127 (119, 136) | 8 (−4, 20) | 0.99 (0.93, 1.06) | 1.00 (−5.80, 7.40) |
| A&E attendance | 10,743/46,601 | 812 (792, 834) | 12,021/46,435 | 885 (864, 907) | −73 (−102, −43) | 0.89 (0.87, 0.91) | 10.90 (8.60, 13.20) |
| Unplanned hospitalization | 31,245/47,671 | 104 (96, 112) | 1,419/47,656 | 115 (107, 123) | −11 (−22, 0) | 0.88 (0.81, 0.95) | 12.30 (5.40, 18.70) |
| Pericarditis events | 9/47,802 | 0.31 (0.16, 0.61) | 0/47,837 | - | 0.31 (0.11, 0.52) | - | - |
| Myocarditis events | 3/47,803 | 0.08 (0.03, 0.24) | 0/47,837 | - | 0.08 (−0.01, 0.17) | - | - |
| Second Dose vs. Single Dose Only (n = 220,929 per Group) | |||||||
| Second Dose | Single Dose Only | ||||||
| Positive SARS-CoV-2 test | 6,243/14,788 | 850 (802, 899) | 8,667/13,732 | 898 (861, 935) | −48 (−109, 13) | 0.67 (0.65, 0.69) | 33.10 (30.90, 35.30) |
| COVID-19 A&E attendance | 3/15,220 | 0.14 (0.05, 0.44) | 3/15,223 | 0.14 (0.04, 0.42) | 0.01 (−0.22, 0.23) | 1.00 (0.20, 4.96) | 0.00 (−395.60, 79.80) |
| COVID-19 hospitalization | 9/15,219 | 0.57 (0.29, 1.10) | 15/15,222 | 2.02 (1.12, 3.62) | −1.45 (−2.69, −0.21) | 0.60 (0.26, 1.37) | 40.00 (−37.10, 73.70) |
| COVID-19 critical care | 0/15,220 | - | 0/15,224 | - | - | - | - |
| COVID-19 death | 0/15,220 | - | 0/15,224 | - | - | - | - |
| Non-COVID-19 death | 0/15,220 | - | 0/15,224 | - | - | - | - |
| Fracture | 561/15,182 | 92 (81, 105) | 597/15,184 | 144 (110, 189) | −52 (−92, −11) | 0.94 (0.84, 1.05) | 6.00 (−5.50, 16.20) |
| A&E attendance | 3,615/14,982 | 651 (602, 703) | 3,873/14,957 | 709 (658, 763) | −58 (−132, 15) | 0.93 (0.89, 0.98) | 6.80 (2.50, 10.90) |
| Unplanned hospitalization | 435/15,194 | 69 (60, 80) | 441/15,189 | 67 (58, 77) | 2 (−11, 16) | 0.99 (0.86, 1.13) | 1.40 (−12.60, 13.60) |
| Pericarditis events | 3/15,220 | 0.21 (0.07, 0.66) | 0/15,224 | - | 0.21 (−0.03, 0.45) | - | - |
| Myocarditis events | 0/15,220 | - | 0/15,224 | - | - | - | - |
Effectiveness of the Second Dose Versus the Single Dose Only in Adolescents
In 30,444 person-years follow-up from 441,858 adolescents after first vaccination, there were 14,910 positive SARS-CoV-2 tests; 6 COVID-19 A&E attendances; 24 COVID-19 hospitalizations, none of which included admission to critical care; and no COVID-19 deaths. There were no non-COVID-19-related deaths; 1158 fractures; 7488 A&E attendances; 876 unplanned hospitalizations; three cases of pericarditis; and no cases of myocarditis. All pericarditis events occurred in the single-dose group. Further analyses were restricted to positive SARS-CoV-2 tests, A&E attendance, fractures, and unplanned hospitalization.
The rate of increase in the cumulative incidence of positive SARS-CoV-2 test after the second dose declined between 10 days and 6 weeks after vaccination, then increased (Figure). By 14 weeks, the cumulative incidence of positive SARS-CoV-2 test was similar in the second and single-dose groups. The 20-week risks per 10,000 were 850 (95% CI: 802, 899) after the second dose and 898 (861, 935) after the single dose. The IRR comparing second with single doses was 0.67 (95% CI: 0.65, 0.69), and the vaccine effectiveness was 33.1 (30.9, 35.3) (Table). 1 2
The incidence of fractures (negative control outcome) was similar in the second and single-dose groups; the IRR was 0.94 (95% CI: 0.84, 1.05), and the vaccine effectiveness was 6.0 (5.5, 16.2). The 20-week risks per 10,000 were 92 (95% CI: 81, 105) in the second dose group and 144 (110, 189) in the single-dose group. The incidence of A&E attendance (safety outcome) was lower after the second than single dose (IRR: 0.93; 0.89, 0.98), and the vaccine effectiveness was 6.8 (2.5, 10.9). The 20-week risks per 10,000 were 651 (95% CI: 602, 703) in the second-dose group and 709 (658, 763) in the single-dose group. The incidence of unplanned hospitalization was similar in the second- and single-dose groups (IRR: 0.99; 0.86, 1.13), and the vaccine effectiveness was 1.4 (−12.6, 13.6). The 20-week risks per 10,000 were 69 (60, 80) in the second-dose group and 67 (58, 77) in the single-dose group (Table). 2
Myocarditis and Pericarditis in Adolescents
Half or fewer (in order to comply with statistical disclosure control obligations and minimize the risk of reidentification of individuals, we do not report rates at higher precision) of adolescents diagnosed with pericarditis were admitted to hospital, and half or fewer attended A&E. More than half of adolescents with myocarditis were admitted to hospital, and more than half attended A&E. The maximum length of critical care admission was 1 day for either event. The maximum length of hospitalization stay was 0 days for pericarditis and 2 days for myocarditis. There were no deaths after these events.
Children
Of 177,360 children eligible in the first vaccination group, 141,711 (80%) were matched with unvaccinated controls (eFigure 1;). In addition, 66,231 (67%) of 99,102 children who received a second BNT162b2 vaccination were matched with single-vaccinated control (eFigure 1;). Nearly 60% of children in the first vaccination group received a second vaccination (eFigure 2;). Most second vaccinations occurred at least 12 weeks after the first vaccination (eFigure 2;). https://links.lww.com/EDE/C271↗ https://links.lww.com/EDE/C271↗ https://links.lww.com/EDE/C271↗ https://links.lww.com/EDE/C271↗
Effectiveness of First Dose Versus Unvaccinated in Children
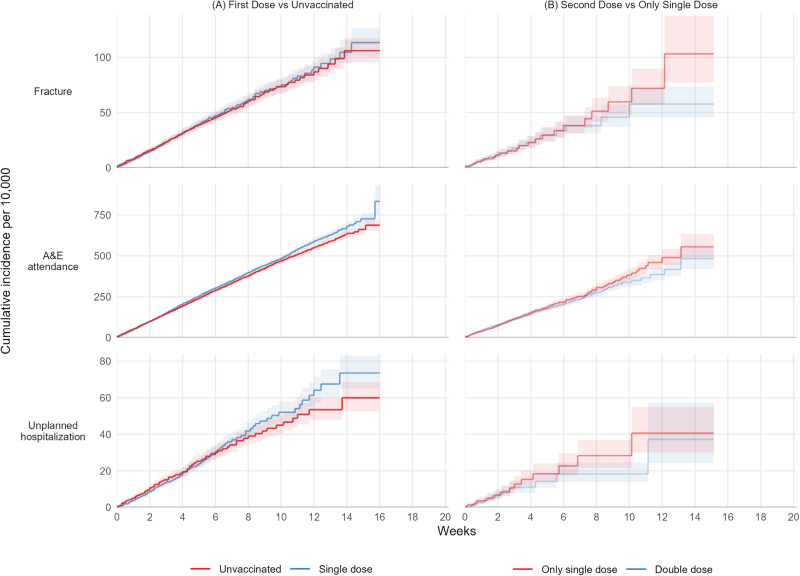
In 32,476 person-years follow-up, there were no COVID-19 A&E attendances; six COVID-19 hospitalizations (none included admission to critical care), and no COVID-19 or non-COVID-19-related deaths. There were 1254 fractures; 8016 A&E attendances; 798 unplanned hospitalizations; three cases of pericarditis; and no cases of myocarditis. All pericarditis events occurred in the first dose group. Further analyses were restricted to fractures, A&E attendance, and unplanned hospitalization (FigureA). 2
The incidence of fractures was similar in the first vaccination and unvaccinated groups (IRR: 1.02; 95% CI: 0.91, 1.14), and the vaccine effectiveness was −2 (−13.9, 8.7). The 20-week risks per 10,000 were 113 (95% CI: 102, 127) in the single-dose group and 106 (95, 118) in the unvaccinated group. The incidence of A&E attendance was higher after the first vaccination than in the unvaccinated group (IRR: 1.05; 95% CI: 1.01, 1.10), and the vaccine effectiveness was −5.2 (−9.9, −0.7). The 20-week risks per 10,000 were 834 (748, 929) in the single-dose group and 687 (653, 723) in the unvaccinated group. The IRR comparing the incidence of unplanned hospitalization in the first vaccination and unvaccinated groups was 1.10 (95% CI: 0.95, 1.26), and the vaccine effectiveness was −9.5; −5.8, 4.7). The 20-week risks per 10,000 were 73 (65, 83) in the single-dose group and 60 (52, 69) in the unvaccinated group (Table). 3

Kaplan–Meier estimates of cumulative incidence of outcomes in children.
| Outcome | Events/Person-Years | 20-Week Risk/10,000 (95% CI) | Events/Person-Years | 20-Week Risk/10,000 (95% CI) | RD per 10,000 People (95% CI) | IRR (95% CI) | VE (95% CI) |
|---|---|---|---|---|---|---|---|
| First Dose vs. Unvaccinated (n = 141,711 per Group) | |||||||
| First Dose | Unvaccinated | ||||||
| COVID-19 A&E attendance | 0/16,233 | - | 0/16,243 | - | - | - | - |
| COVID-19 hospitalization | 3/16,233 | 0.26 (0.08, 0.79) | 3/16,242 | 0.27 (0.09, 0.85) | −0.02 (−0.44, 0.41) | 1.00 (0.20, 4.96) | −0.10 (−395.70, 79.80) |
| COVID-19 critical care | 0/16,233 | - | 0/16,243 | - | - | - | - |
| COVID-19 death | 0/16,233 | - | 0/16,243 | - | - | - | - |
| Non-COVID-19 death | 0/16,233 | - | 0/16,243 | - | - | - | - |
| Fracture | 633/16,175 | 113 (102, 127) | 621/16,183 | 106 (95, 118) | 7 (−9, 24) | 1.02 (0.91, 1.14) | −2.00 (−13.90, 8.70) |
| A&E attendance | 4,107/15,862 | 834 (738, 929) | 3,909/15,878 | 687 (653, 723) | 146 (49, 244) | 1.05 (1.01, 1.10) | −5.20 (−9.90, −0.70) |
| Unplanned hospitalization | 417/16,196 | 73 (65, 83) | 381/16,204 | 60 (52, 69) | 14 (1, 26) | 1.10 (0.95, 1.26) | −9.50 (−25.80, 4.70) |
| Pericarditis events | 3/16,233 | 0.22 (0.07, 0.67) | 0/16,243 | - | 0.22 (−0.03, 0.46) | - | - |
| Myocarditis events | 0/16,233 | - | 0/16,243 | - | - | - | - |
| Second Dose vs. Single Dose Only (n = 66,231 per Group) | |||||||
| Second Dose | Single Dose Only | ||||||
| COVID-19 A&E attendance | 0/4,436 | - | 0/4,439 | - | - | - | - |
| COVID-19 hospitalization | 0/4,436 | - | 0/4,439 | - | - | - | - |
| COVID-19 critical care | 0/4,436 | - | 0/4,439 | - | - | - | - |
| COVID-19 death | 0/4,436 | - | 0/4,439 | - | - | - | - |
| Non-COVID-19 death | 0/4,436 | - | 0/4,439 | - | - | - | - |
| Fracture | 123/4,427 | 58 (45, 73) | 141/4,431 | 103 (77, 138) | −46 (−78, −13) | 0.87 (0.69, 1.11) | 12.70 (−11.20, 31.40) |
| A&E attendance | 819/4,387 | 483 (419, 557) | 861/4,382 | 556 (488, 632) | −73 (−172, 27) | 0.95 (0.86, 1.05) | 5.00 (−4.50, 13.70) |
| Unplanned hospitalization | 63/4,432 | 37 (24, 57) | 81/4,431 | 41 (30, 55) | −3 (−24, 17) | 0.78 (0.56, 1.08) | 22.20 (−8.10, 44.10) |
| Pericarditis events | 0/4,436 | - | 0/4,439 | - | - | - | - |
| Myocarditis events | 0/4,436 | - | 0/4,439 | - | - | - | - |
Effectiveness of Second Dose Versus Single Dose Only in Children
In 8875 person-years follow-up, there were no COVID-19 A&E attendances; no COVID-19 hospitalizations; no admissions to critical care; and no COVID-19 or non-COVID-19-related deaths. There were 264 fractures, 1680 A&E attendances, 144 unplanned hospitalizations, and no cases of pericarditis or myocarditis. Further analyses were restricted to fractures, A&E attendance, and unplanned hospitalization (FigureB). 2
The IRR comparing the incidence of fractures in the second- and single-dose groups was 0.87 (95% CI: 0.69, 1.11), and the vaccine effectiveness was 12.7 (−11.2, 31.4). The 20-week risks per 10,000 were 58 (95% CI: 45, 73) in the second-dose group and 103 (77, 138) in the single-dose group. The incidence of A&E attendance was similar in the second- and single-dose groups (IRR: 0.95; 0.86, 1.05), and the vaccine effectiveness was 5.0 (−4.5, 13.7). The 20-week risks per 10,000 were 483 (419, 557) and 556 (488, 632), respectively. The IRR comparing the incidence of unplanned hospitalization in the second- and single-dose groups was 0.78 (95% CI: 0.56, 1.08), and the vaccine effectiveness was 22.2 (−8.1, 44.1). The 20-week risks per 10,000 were 37 (24, 57) in the second-dose group and 41 (30, 55) in the single-dose group (Table). 3
Myocarditis and Pericarditis Events in Children
No children experienced a myocarditis event; all three pericarditis events occurred after first vaccination and did not require hospitalization or critical care.
DISCUSSION
This observational cohort study of COVID-19 vaccination with BNT162b2 in England was based on 410,463 adolescents (12–15 years old) receiving a first vaccination, 220,029 adolescents receiving a second vaccination, 141,711 children (5–11 years old) receiving a first vaccination, and 66,231 children receiving a second vaccination. We estimated an initial protective effect against a positive SARS-CoV-2 test in adolescents that waned by 14 weeks. The incidence of COVID-19 A&E attendance was lower after the first vaccination than in the unvaccinated group for adolescents, and COVID-19 A&E attendance was rare in the other adolescent group and the child groups. COVID-19-related hospitalization and critical care attendance were rare in both adolescents and children, and there were no COVID-19-related deaths. While rare, all myocarditis and pericarditis events during the study period occurred in vaccinated individuals: there were no deaths after myocarditis or pericarditis. The rate of fractures was similar across vaccine groups in both adolescents and children. None of the child cohort required hospitalization or critical care after a pericarditis event. In the adolescents, the maximum length of hospital admission was 1 day for critical care and 2 days for hospitalization.
Our findings provide insights into the balance between protection by vaccination against target outcomes (positive SARS-CoV-2 tests, COVID-19-related hospitalization, and A&E attendance) and the increased risk of pericarditis and myocarditis. In adolescents, the reduction in risk of COVID-19 hospitalization per 10,000 individuals (−1.14 for first dose vs. unvaccinated, −1.45 for second vs. first dose) was larger than the increase in risk of both myocarditis (0.08 for first dose vs. unvaccinated) and pericarditis (0.31 for first dose vs. unvaccinated, 0.21 for second vs. first dose). However, the reduction in risk of COVID-19 hospitalization in children (−0.02 for first dose vs. unvaccinated) was lower than the increase in risk of pericarditis (0.22).
Strengths and Limitations
Our study has several limitations. First, positive SARS-CoV-2 test data underestimates the true incidence of infection. Both lateral flow tests and polymerase chain reaction tests were freely available in the United Kingdom until 31 March 2023, but many asymptomatic and symptomatic infections will not have been recorded.
Second, myocarditis and pericarditis following COVID-19 vaccination were publicly reported from May 2021.The vaccinations in our study were after this date, so there is a potential for ascertainment bias if diagnostic thresholds were lower in vaccinated than unvaccinated individuals. 12
Third, outcome ascertainment relies on routinely collected data rather than the rigorous, active case-finding often deployed in randomized trials. Consequently, potential differences in health-seeking behaviors, by children or their parents or carers, may mean that vaccinated children are more willing or able to present to healthcare services than unvaccinated children for mild symptoms or for SARS-CoV-2 testing. This could result in an underestimation of effectiveness and safety endpoints in the unvaccinated group compared with the vaccinated group, in turn underestimating vaccine effectiveness and vaccine safety for nonsevere endpoints.
Fourth, we excluded clinically vulnerable children and adolescents who were eligible for vaccination before the general roll-out, so our results may not be generalizable to this group. Vaccine safety and effectiveness in this group are important, but there are substantial challenges in controlling confounding arising from unmeasured severity of underlying conditions that could influence vaccine uptake and effectiveness. Sixth, due to small numbers, we did not study vaccine effectiveness in those who had received a vaccination other than BNT162b2.
Fifth, we did not look at safety events after SARS-CoV-2 infection, and so our study does not shed light on the relative safety of vaccination compared with infection.
Sixth, though the detailed data available in OpenSAFELY allowed us to match vaccinated individuals with control individuals on multiple characteristics, bias due to unmeasured confounding cannot be ruled out. For instance, differences in testing behavior between vaccinated and unvaccinated people may have contributed to the apparent waning effect if testing is more common among vaccinated individuals. Similarly, healthcare-seeking behaviors or access are likely to influence both vaccination and the desire or ability to seek care for mild to moderate symptoms such as those associated with myocarditis and pericarditis. Unmeasured differences in health-seeking behaviors may therefore account for some of the observed differences in safety endpoints. Further, it was not possible to reliably identify individuals with COVID-19 symptoms before testing or hospital admission, because this information is not routinely recorded in primary care records. Delayed vaccination in individuals with symptoms may explain the apparent effectiveness against positive tests during the first week (eFigures 3 and 4;); however, the incidence of positive tests substantially reduced from 1 to 2 weeks in the vaccinated group (FigureA) compared with the unvaccinated group, consistent with a delayed but protective immunological response to vaccination. A similar pattern was observed for second-dose versus single-dose vaccination (FigureB). Lifestyle factors that may influence both health and vaccination are not fully recorded in health records. The slightly higher rate of fractures (negative control outcome) in single-vaccinated adolescents and children compared with the second dose group could indicate limited unmeasured confounding. https://links.lww.com/EDE/C271↗ 1 1
Finally, we made certain pragmatic statistical design decisions for computational expediency. The standard errors used to calculate CIs ignore the nonindependence between treatment groups due to the possibility of individuals experiencing outcomes in both unvaccinated and vaccinated groups. This is mitigated by including only those individuals who have no record of COVID-19 infection or disease within 30 days before the start of follow-up, but outcomes in the same individual across both groups are still possible. CIs may therefore be too narrow. We used pair-censoring to ensure balance in follow-up duration between treatment groups. However, informative censoring due to postbaseline factors may remain. Our use of matching leads to the exclusion of eligible participants. However, the generalizability of the results will only be affected if there are modifiers of vaccine effectiveness whose characteristics differ between vaccinated and unvaccinated participants.
Findings in Context
BNT162b2 vaccination was shown to be effective in protecting against COVID-19 infection in a multinational phase 3 trial of 2260 adolescents aged 12–15 with a median follow-up of 2 months.Multiple observational studies have found that effectiveness wanes with time since vaccination.A recent systematic review found generally limited evidence regarding clinical outcomes of BNT162b2 vaccination among children and adolescents,although vaccination lowered hospitalization rates, including emergency admission. , 13 14 , 15 16 17
Several studies have reported that children infected with SARS-CoV-2 appear to have the same degree of severity of illness as seen in adults.Most reported postvaccination cases of myocarditis and pericarditis in children and adolescents were mild.A self-controlled case-series study of 5.1 million children in England estimated 3 (95% CI: 0, 5) and 5 (95% CI: 3, 6) additional cases of myocarditis in adolescents per million following a first and second dose with BNT162b2, respectively.A systematic review found that myocarditis and pericarditis in children and adolescents were more prevalent among males and after the second dose of BNT162b2.While all cases of myocarditis and pericarditis in our study occurred in the vaccinated groups, we did not find higher rates of myocarditis or pericarditis after the second compared with the first dose. The rates of heart inflammation (myocarditis and pericarditis) in under 18s reported by the UK Medicines and Healthcare products Regulatory Agency were 13 and 8 per million after first and second doses, respectively, compared with our estimates of 27 and 10 per million, respectively. That there were no cases of myocarditis or pericarditis in the unvaccinated group does not mean that such events cannot occur without COVID-19 vaccination, only that these events were not observed in the unvaccinated groups in our specific matched analyses. – 18 20 21 22 23
CONCLUSIONS
This study found that initial protection by BNT162b2 vaccination against positive SARS-CoV-2 tests in adolescents aged 12–15 had waned by 14 weeks after vaccination. Rates of COVID-19 hospitalization and COVID-19 A&E attendance were lower after the first and second dose BNT162b2 vaccination in adolescents. Positive SARS-CoV-2 testing could not be considered for children. Severe outcomes were rare in children: there were fewer than seven (exact number redacted) COVID-19 hospitalizations and no COVID-19 A&E attendances, critical care admissions, or COVID-19 deaths.
ACKNOWLEDGMENTS
We are very grateful for all the support received from the TPP Technical Operations team throughout this work, and for generous assistance from the information governance and database teams at NHS England and the NHS England Transformation Directorate.