
What this is
- This analysis examines the relationship between () and markers during calorie restriction (CR) in individuals without obesity.
- Data were drawn from the CALERIE™ phase 2 trial, which involved a 25% reduction in energy intake over two years.
- The study investigates how changes in relate to strength, aerobic capacity, and cardiometabolic health markers.
Essence
- A smaller reduction in during calorie restriction was associated with improvements in grip strength, insulin resistance, and HDL cholesterol in individuals without obesity.
Key takeaways
- A smaller decrease in was linked to a 0.504 kg increase in grip strength. This suggests that maintaining during calorie restriction may help preserve muscle function.
- Improvements in insulin resistance were observed with a smaller decline in , indicated by a reduction in HOMA-IR by 0.032. This highlights the potential metabolic benefits of sustaining .
- Participants who maintained higher reported more minutes of physical activity, with an increase of 0.250 minutes per 100 kcal/day reduction in . This suggests a positive feedback loop between and physical activity.
Caveats
- The study is observational and cannot establish causation between and markers. Further research is needed to confirm these relationships.
- Self-reported physical activity data may introduce bias, necessitating objective measures in future studies to validate findings.
- The sample size may limit the ability to detect certain associations, indicating a need for larger studies to confirm these results.
Definitions
- Healthspan: The period of life spent in good health, free from chronic diseases and disabilities.
- Physical Activity Energy Expenditure (PAEE): Total daily energy expenditure minus resting metabolic rate and the thermic effect of food.
Simplified
Introduction
An aging population presents significant challenges for societies, including the rising prevalence of functional decline and metabolic diseases [1]. Calorie restriction (CR) is a dietary regimen that is low in calories but does not lead to malnutrition [2]. In several non-human species, CR extends life span [3], while humans who voluntarily adopt CR may improve markers associated with healthspan, which is defined as the period of life spent in good health, free from the chronic diseases and disabilities [4 –6]. The Comprehensive Assessment of Long-term Effects of Reducing Intake of Energy (CALERIE)™ phase 2 study showed that two years of CR, which targeted a 25% decrease in energy intake, induced benefits in healthy humans without obesity [1], including improvements in blood lipids and decreased insulin resistance [7]. Additionally, CR improved maximal oxygen uptake (V̇O2max), which is related to mortality [8], and did not decrease strength relative to control [9]. This indicates that CR in healthy humans has the potential to reduce the societal burden of aging by enhancing healthspan and lowering the risk of age-related diseases.
It is unclear how physical activity-related energy expenditure (PAEE), defined as total daily energy expenditure (TDEE) minus resting metabolic rate (RMR) and the thermic effect of food, affects markers of healthspan during CR in healthy people without obesity. In CALERIE™ phase 1, aerobic exercise improved fasting insulin and blood lipids when combined with CR over 6 months, with no differences compared to CR alone [10, 11]. Research, however, is needed to test the association between PAEE and markers of healthspan during prolonged CR. Das and colleagues showed that a smaller decrease in PAEE was related to increased fat-free mass during two years of CR [12], but other areas of study are necessary. First, observations are needed to determine whether PAEE is positively associated with measures related to muscle quality and healthspan, namely strength, aerobic capacity, and cardiometabolic disease risk markers. Second, to identify targetable strategies and behaviors that alter CR-induced benefits, investigations are needed to examine whether PAEE is related to the amount of physical activity (PA) during CR. These analyses are critical as PAEE can be affected by weight loss [13] and consequently may not be directly related to PA time during CR. Third, analyses are required to ascertain whether weight status moderates the association between PAEE and healthspan markers, because CR and PA could trigger distinct health responses in individuals who are normal weight and overweight [14]. Together, such investigations will help determine whether PAEE could be modified to augment the benefits of prolonged CR and further decrease long-term disease risk in individuals without obesity who exhibit healthy metabolic parameters at baseline.
The primary aim of this post-hoc analysis was to explore the association between PAEE and markers of healthspan, namely strength, aerobic capacity, and cardiometabolic disease risk markers, during prolonged CR in individuals without obesity. The secondary aim was to examine the association between PAEE and minutes of PA during CR. The tertiary aim was to examine if weight status moderates the relationship between PAEE and healthspan markers and minutes of PA.
Methods
CALERIE™ phase 2
The present is a post-hoc observational analysis of the CALERIE™ phase 2 study, which was a two-year randomized clinical trial (clinicaltrials.gov registration: NCT00427193) carried out from January 2007 to November 2012 at three locations: Pennington Biomedical Research Center in Baton Rouge, LA; Washington University School of Medicine in St. Louis, MO; and Tufts University in Boston, MA. The Duke Clinical Research Institute, NC, coordinated the study [1, 15]. The protocol received approval from the institutional review boards at each site and the coordinating center, and participants gave written informed consent.
Participants
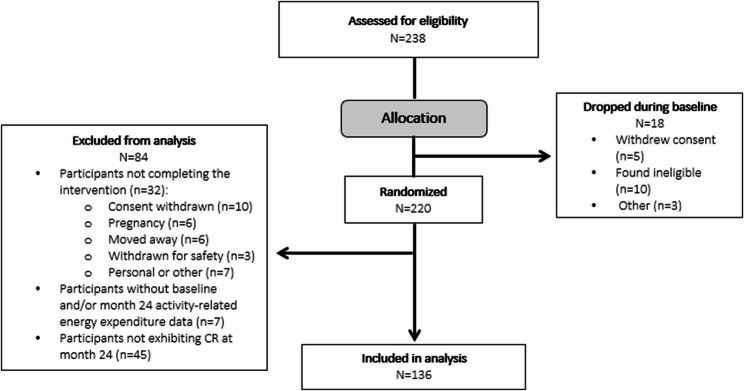
Details of the CALERIE™ 2 trial recruitment, screening, and exclusion criteria are provided elsewhere [15 –17]. In summary, 220 healthy individuals with a body mass index (BMI) of 22.0 to < 28.0 kg/m², aged 21–50 years, were randomized. Participants were ineligible if they had significant medical conditions and if they engaged in PA for 30 min for 5 or more days a week. This threshold of PA was chosen because of an anticipated intentional decrease in regular PA from individuals with high habitual activity patterns, which may confound results of the CALERIE™ 2 trial primary analysis [16].
Study design
Participants underwent baseline testing before randomization. This included outcome assessments and habitual energy intake to establish a 25% CR target. Participants were randomized to either a CR group or an ad libitum (AL) control group for 2 years, with randomization stratified by study site, sex, and BMI; BMI was categorized into normal weight and overweight. Participants were assigned in a 2:1 ratio favoring CR within each stratum. A permuted block randomization technique was used to randomize participants by a member of the research team; treatment assignment was conducted using a telephone-based voice-response system [15].
Details of the CR intervention are available elsewhere [17]. Briefly, the intervention aimed for an immediate 25% reduction in energy intake. This was determined and monitored using the intake-balance method with doubly labelled water (DLW) measures and changes in body composition [15], which were measured using dual-energy X-ray absorptiometry (Hologic 4500 A, Delphi W, or Discovery). Further, a mathematical model was devised and guided individual participant weight change [17]. The CR group received counselling sessions led by interventionists covering strategies to support CR adherence. There were 12 group sessions delivered in the first 26 weeks and a monthly group session from weeks 27 to 104. The AL control group had quarterly sessions with investigators but did not receive any counselling. Both groups were provided with multivitamin and calcium supplements, and neither group was prescribed PA. Participants were not blinded to their intervention group, although evaluation staff were.
Measurements
Physical activity energy expenditure (PAEE)
Energy expended in physical activity was estimated using assessments of TDEE and RMR. TDEE was assessed by DLW. For each DLW assessment, two baseline urine samples were collected before participants consumed a cocktail containing 0.1 g of ²H₂O (99.98% atom ²H) and 0.16 g of 100% ¹⁸O per kilogram of body weight. After ingesting the DLW, participants supplied a complete first urine void approximately 1–3 h post-ingestion, followed by six timed urine collections: two samples around 4.5 and 6 h after dosing, two on day 7 after ingestion, and two on day 14 after ingestion. Hydrogen and oxygen isotope enrichments were measured using gas-isotope-ratio mass spectrometry using validated protocols [18, 19]. The carbon dioxide production rate was calculated from the fractional turnover rates of ²H (kH) and ¹⁸O (kO) [20]. Consistent with the primary outcome paper [15], TDEE was then estimated based on the energy equivalent of a liter of CO2 to be 3.815/respiratory quotient (RQ) + 1.2321. The RQ was determined individually based on food diaries and changes in body composition; more specifically, macronutrient intakes from food diaries collected were scaled to predicted energy intake (from sex, age, fat mass, and fat-free mass), and daily changes in body stores were derived from regressions of daily home and clinic weights [15]. The resulting substrate balance was used to compute a participant-specific RQ, which was applied in the DLW calculation of total energy expenditure [15]. Indirect calorimetry was utilized to estimate RMR using a calibrated Vista-MX metabolic cart (Vacumed, Ventura, CA). PAEE was calculated using the formula: PAEE = TDEE*0.9 – RMR. TDEE was multiplied by 0.9 before subtraction of RMR because we estimated that 10% of TDEE occurs due to the thermic effect of food [9]. Similar to previous studies [11], PAEE residuals were then calculated from baseline regression models that included age, sex, fat mass, and fat-free mass as covariates. Thus, PAEE residuals were considered PAEE values adjusted for known determinants and were the primary exposure variable in this analysis, given the strong positive link between body mass and PAEE [21]. Physical activity level (PAL) was calculated using the formula: TDEE/RMR. We also used PAL as an exposure variable because, despite issues of using a ratio with a nonzero intercept [22], it is favored by some researchers [23].
Outcome measures
This analysis uses outcomes assessed at baseline and month 24 by evaluation staff. Grip strength was assessed using a Jamar dynamometer (Asimow Engineering Company, Los Angeles, CA). The right and left hands were tested alternately three times, with the peak recorded from each test. We calculated overall grip strength as the mean of the peak grip strength values from the left and right hands. Absolute and relative V̇O2max and treadmill exercise time were determined using the Cornell treadmill test for those who met the V̇O2max criteria [9]. Fasting plasma samples were analyzed for cardiometabolic disease risk markers. Total cholesterol (total-C) and triglycerides (TG) were determined using automated enzymatic commercial kits (Miles-Technicon, Tarrytown, NY, USA). High-density lipoprotein cholesterol (HDL-C) was measured by dextran sulfate (50000 MW) and low-density lipoprotein cholesterol (LDL-C) was calculated using the Friedewald Equation [24]. Plasma glucose and insulin was measured by the glucose oxidase method (YSI Instruments, Fullerton, CA, USA) and chemiluminescent immunoassay (Elecsys, Roche Diagnostics, Indianapolis, IN), respectively, and the homeostasis model assessment for insulin resistance (HOMA-IR) was calculated (fasting glucose [mmol/L] × fasting insulin [µIU/mL]/22∙5) [25]. Further, we calculated the total: HDL-C ratio and the TG: HDL ratio, given its association with cardiometabolic disease risk [26, 27]. The Stanford 7-day Physical Activity Recall questionnaire was used to estimate average self-reported minutes/day of PA [28, 29].
Statistical analysis
Our main aims were to examine the association between change in PAEE residual and change in healthspan markers and minutes of PA during prolonged CR. Hence, the change in the PAEE residual (baseline to month 24) was the exposure variable and change in markers of healthspan and minutes of PA (baseline to month 24) were outcome variables. Completers who demonstrated CR per the intake-balance method at month 24 (percent CR > 0%) were included in the analyses, regardless of randomization group, as this method was the objective and principal indicator of CR in CALERIE™ phase 2 [15]. We also included individuals with TDEE and RMR measurements (and thus PAEE) at each timepoint.
Analyses were conducted using SPSS version 29.0 (SPSS Inc, Chicago, IL). General linear models were used to calculate change in weight, body composition, PAEE, and energy intake, with time (baseline vs. month 24) used as fixed factor. Multivariate linear regression examined the association between change in the PAEE residual and change in outcomes at month 24. Models were adjusted for site, baseline PAEE residual, BMI class (categorical variable: normal weight vs. overweight), randomization group, and baseline of the outcome variable. We performed confirmatory analyses, including: (1) the primary adjusted analysis including participants who displayed CR (percent CR > 0%) at month 12 and month 24; (2) the primary adjusted analysis with PAEE (unadjusted for known determinants) as the exposure variable; and (3) the primary adjusted analysis with PAL as the exposure variable. Furthermore, we examined if the associations between the PAEE residual and outcomes were different in individuals who were normal weight and overweight at baseline by adding BMI class (normal weight [22.0 ≤ BMI < 25.0 kg/m²] vs. overweight [25.0 ≤ BMI < 28.0 kg/m²]) as an interaction term. Significant interactions were probed by assessing the conditional relationship of PAEE residual change and change in the outcome variable for each BMI class. This was achieved by calculating estimate coefficients (95% CI) for individuals who were normal weight and overweight. The distribution of data was checked for normality and the square-root (sqrt) transformation was applied to skewed data. This was a complete case analysis, with participants removed if they had missing outcome data. A P value of < 0.05 was deemed statistically significant because, notwithstanding multiple testing, the project was post-hoc and thus exploratory [30].
Results
Participants
General linear model showed weight decreased in the studied cohort (P < 0.001; Table 2), with weight changing by −8.4% (95% CI, −9.4, −7.3) at month 24. There was similarly a −4.3 (95% CI, −4.9, −3.7) kg and − 1.7 (−2.0, −1.4) kg change in fat mass and fat-free mass, respectively (P < 0.001), a reduction in measures of PAEE and PAL (P ≤ 0.003), and per design of the analysis, a decrease in energy intake (all P < 0.001; Table 2). Multiple linear regression showed that change in PAEE residual was positively related to change in energy intake after adjustments for site, baseline PAEE residual, BMI class, randomization group, and baseline energy intake (β = 0.374; P < 0.001).

Study participant CONSORT
| Variable ( = 136)N | Valuesa | |
|---|---|---|
| Age (year) | 38.6 (7.4) | |
| Sex | ||
| Male | 39 (28.7) | |
| Female | 97 (71.3) | |
| Race | ||
| White | 108 (79.4) | |
| Black | 16 (11.8) | |
| Asian | 6 (4.4) | |
| Other | 6 (4.4) | |
| BMI class | ||
| Normal weight | 63 (46.3) | |
| Overweight | 73 (53.7) | |
| Family household income | ||
| $0 - $19,999 | 6 (4.4) | |
| $20,000 - $39,999 | 12 (8.8) | |
| $40,000 - $59,999 | 25 (18.4) | |
| $60,000 - $79,999 | 11 (8.1) | |
| $80,000 - $99,999 | 27 (19.9) | |
| >$100,000 | 55 (40.4) | |
| Randomization group | ||
| Calorie restriction | 104 (76.5) | |
| Ad libitum | 32 (23.5) | |
| Variable ( = 136)N | Baselineb | Month 24b | Differenceb | P |
|---|---|---|---|---|
| Weight (kg) | 72.6 (70.9, 74.2) | 66.5 (64.8, 68.2) | −6.1 (−6.9, −5.3) | < 0.001 |
| BMI (kg/m)2 | 25.3 (25.1, 25.6) | 23.2 (22.9, 23.6) | −2.1 (−2.4, −1.9) | < 0.001 |
| Fat mass (kg) | 24.1 (23.3, 24.9) | 19.8 (18.9, 20.7) | −4.3 (−4.9, −3.7) | < 0.001 |
| Fat-free mass (kg) | 48.5 (46.9, 50.0) | 46.8 (45.3, 48.3) | −1.7 (−2.0, −1.4) | < 0.001 |
| PAEE (kcal/day) | 817 (777, 857) | 693 (650, 737) | −124 (−165, −82) | < 0.001 |
| PAEE residual (kcal/day) | 24 (−9, 56) | −111 (−149, −74) | −135 (−176, −95) | < 0.001 |
| PAL | 1.76 (1.73, 1.79) | 1.69 (1.66, 1.73) | −0.06 (−0.10, −0.02) | 0.003 |
| Energy intake (kcal/day) | 2481 (2413, 2549) | 2186 (2124, 2247) | −295 (−325, −266) | < 0.001 |
Association between PAEE and outcomes
Multivariate linear regression results are displayed in Table 3. A smaller decrease (or relative increase) in PAEE residual was not associated with change in absolute V̇O2max (estimate, −0.0112 [95% CI, −0.0361, 0.0137] L/min), relative V̇O2max (estimate, −0.027 [95% CI, −0.445, 0.391] mL/kg/min) or change in treadmill exercise time (estimate, −0.014 [95% CI, −0.043, 0.015] sqrt min); yet a smaller reduction in the PAEE residual was associated with an increase in grip strength (P = 0.040). Specifically, a 100 kcal/day attenuated decline in the PAEE residual was associated with a 0.504 (0.023, 0.986) kg rise in grip strength. Further, following adjustment, an attenuated decline in the PAEE residual was associated with improvements in HOMA-IR (estimate, −0.032 [95% CI, −0.062, −0.002]; P = 0.036), HDL-C (estimate, 1.011 [95% CI, 0.356, 1.666] mg/dL; P = 0.003), and the TG: HDL ratio (estimate, −0.026 [95% CI, −0.051, −0.001] sqrt; P = 0.043). A smaller decrease in the PAEE residual was not, however, related to other cardiometabolic disease risk markers (P ≥ 0.053).
A smaller decline in the PAEE residual was associated with minutes of PA, with each 100 kcal/day attenuated reduction in the PAEE residual associated with a 0.250 (95% CI, 0.028, 0.472) sqrt min/day increase in time engaged in PA (P = 0.028). Analyses including all participants who completed the trial (regardless of treatment) showed a broadly similar pattern (data not shown).
As displayed in Supplemental Tables 2–4, confirmatory analyses were analogous, with similar effect sizes (standardised β values); although a smaller decrease in absolute PAEE change was associated with a significant reduction in total: HDL-C ratio and insulin (P ≤ 0.035; Supplemental Table 3), and an attenuated reduction in PAL was not associated with a significant reduction in the TG: HDL ratio (P = 0.119; Supplemental Table 4).

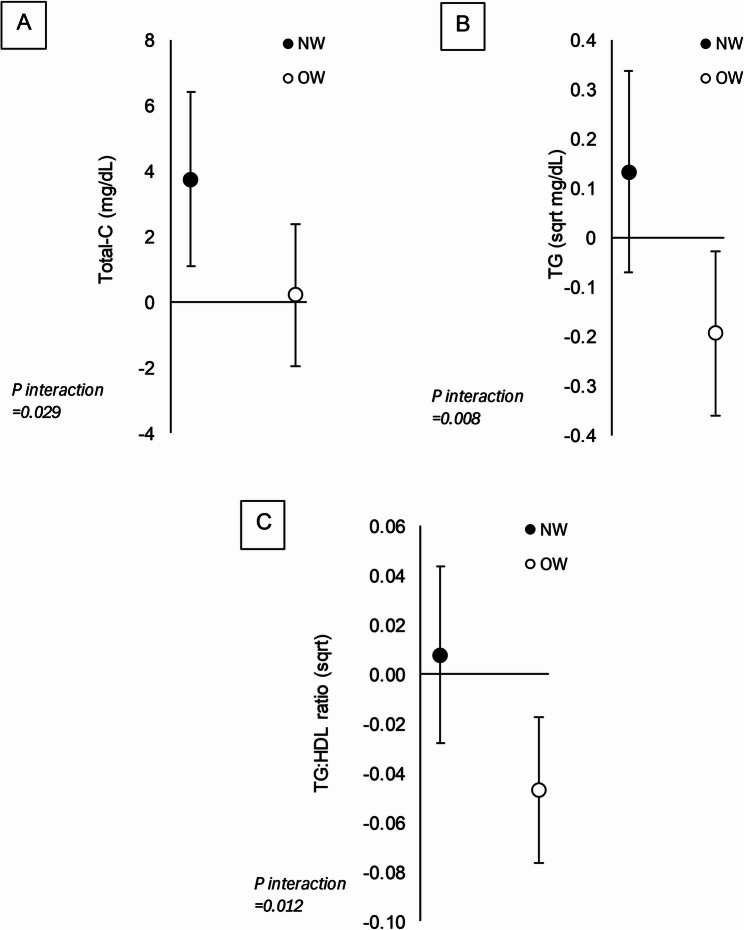
Association between change in PAEE residual and lipid markers based on weight status. Data are estimates (95% CI) representing the change in total-C (), TG (), and the TG: HDL ratio () per 100 kcal/day increase in PAEE residual in individuals who are normal weight (NW) and overweight (OW). Abbreviations: BMI, body mass index; HDL, high-density lipoprotein; TG, triglycerides; total-C, total cholesterol. Data missing for 1 participant A B C
| Mean ± SD change | Crude model | Adjusted modeld | |||||
|---|---|---|---|---|---|---|---|
| Estimateb | βc | P | Estimateb | βc | P | ||
| Strength and aerobic capacity | |||||||
| Grip strength (kg)e | −1.92 ± 6.85 | 0.769 (0.293, 1.246) | 0.268 | 0.002 | 0.504 (0.023, 0.986) | 0.176 | 0.04 |
| V̇O(L/min)2maxf | −0.15 ± 0.24 | −0.0002 (−0.0219, 0.0215) | −0.002 | 0.986 | −0.0112 (−0.0361, 0.0137) | −0.108 | 0.375 |
| V̇O(mL/kg/min)2maxf | 0.98 ± 4.22 | 0.058 (−0.322, 0.439) | 0.032 | 0.761 | −0.027 (−0.445, 0.391) | −0.015 | 0.898 |
| Treadmill exercise time (sqrt min)f | 0.14 ± 0.30 | −0.023 (−0.049, 0.004) | −0.174 | 0.097 | −0.014 (−0.043, 0.015) | −0.111 | 0.327 |
| Cardiometabolic disease risk markers | |||||||
| Total-C (mg/dL)g | −4.58 ± 24.39 | 1.281 (−0.461, 3.022) | 0.125 | 0.148 | 1.553 (−0.279, 3.384) | 0.152 | 0.096 |
| HDL-C (mg/dL)g | 4.02 ± 8.14 | 0.955 (0.393, 1.518) | 0.28 | 0.001 | 1.011 (0.356, 1.666) | 0.296 | 0.003 |
| LDL-C (mg/dL)g | −5.04 ± 19.75 | 0.651 (−0.767, 2.068) | 0.078 | 0.366 | 0.885 (−0.631, 2.401) | 0.107 | 0.25 |
| TG (sqrt mg/dL)g | −0.87 ± 1.88 | −0.062 (−0.197, 0.072) | −0.079 | 0.362 | −0.070 (−0.212, 0.072) | −0.089 | 0.329 |
| Total: HDL-C ratiog | −0.38 ± 0.64 | −0.041 (−0.087, 0.004) | −0.153 | 0.076 | −0.035 (−0.080, 0.009) | −0.130 | 0.122 |
| TG: HDL ratio (sqrt)g | −0.18 ± 0.33 | −0.026(−0.050, −0.003) | −0.189 | 0.028 | −0.026 (−0.051, −0.001) | −0.186 | 0.043 |
| Fasting glucose (mg/dL)g | −0.26 ± 4.71 | −0.214 (−0.551, 0.123) | −0.108 | 0.212 | −0.201 (−0.523, 0.121) | −0.102 | 0.219 |
| Fasting insulin (µIU/mL)g | −1.17 ± 2.29 | −0.038 (−0.202, 0.127) | −0.039 | 0.649 | −0.138 (−0.279, 0.002) | −0.144 | 0.053 |
| HOMA-IRg | −0.24 ± 0.50 | −0.013 (−0.048, 0.023) | −0.061 | 0.482 | −0.032 (−0.062, −0.002) | −0.155 | 0.036 |
| PA minutes | |||||||
| PA minutes/day (sqrt min/day) | −1.13 ± 3.05 | 0.313 (0.102, 0.525) | 0.245 | 0.004 | 0.250 (0.028, 0.472) | 0.196 | 0.028 |
Discussion
This post-hoc analysis of the CALERIE™ phase 2 trial performed in individuals without obesity examined the association between PAEE change and change in healthspan markers and PA during CR. We showed an attenuated reduction in PAEE during CR was associated with small improvements in grip strength, HOMA-IR, HDL-C, and the TG: HDL ratio; yet change in PAEE was not related to change in aerobic capacity, fasting glucose, total-C, TG, and the total: HDL-C ratio. We also showed that the change in PAEE was positively related to self-reported minutes of PA. Baseline BMI moderated some relationships, with generally favourable relationships between PAEE change and blood lipids in individuals who were overweight but not normal weight. These original findings indicate that approaches which sustain PAEE during long-term CR may enhance strength and several markers of metabolic health in healthy individuals without obesity.
Although CR induces myriad physiological and psychological benefits [1, 7, 15], a reduction in muscle function and fitness is a concern [9, 31], particularly in individuals without obesity who have lower absolute levels of fat-free mass [32]. An attenuated decline in PAEE was associated with a smaller decrease in grip strength during CR in this analysis. This relationship was small (β = 0.176), but it could be noteworthy because there is positive link between grip strength and mortality [33], and low grip strength predicts cardiovascular disease occurrence [34]. Consistent with previous evidence [35], the association between PAEE and strength occurred independent of reductions in FFM, suggesting that elevations in PAEE could enhance muscle quality during CR through neurological adaptations [36]. In contrast to strength, changes in V̇O2max and treadmill exercise time were not related to change in PAEE during CR. These findings collectively indicate that methods which maintain PAEE during CR may be more beneficial for improving strength but not aerobic capacity in individuals without obesity. It is possible that CR-induced improvements in mitochondrial function and skeletal muscle oxidative efficiency [37] constrained any increases in aerobic capacity that might otherwise have been associated with PAEE, although variations in measurement sensitivity could equally play a role.
Improvements in metabolic health have been linked to increased PAEE [38]. This analysis extends these findings by showing that an attenuated reduction in PAEE during CR was related to a decrease in HOMA-IR. Reductions in HOMA-IR were seen in the CR group in CALERIE phase 2 [7]; thus, notwithstanding the small standardised beta (β = −0.155), it is notable that PAEE was related to improvements in insulin resistance in this cohort who exhibited normal HOMA-IR (1.13) at baseline. Indeed, preserving or increasing PAEE could enhance the CR-induced reductions in insulin resistance and decrease future risk of disease in healthy individuals without obesity, given insulin resistance predicts future risk of type 2 diabetes [39] and is linked to the development of metabolic disease [40].
An attenuated decline in PAEE during CR was related to a small increase in HDL-C and reduction in the TG: HDL ratio, albeit PAL change was not associated with the TG: HDL ratio and there were no significant associations with LDL-C. The mechanisms underlying these results are unknown, but sustaining PAEE may stimulate lipoprotein lipase as it is involved in HDL-C production and is increased by PA [41]. The relationship between PAEE change and the change in TG, total-C, and the TG: HDL ratio was moderated by pre-intervention BMI. Specifically, an attenuated reduction in PAEE was related to an increase in total-C in individuals who were normal weight; however, in individuals who were overweight, an attenuated reduction in PAEE during CR was related to reductions in TG and the TG: HDL ratio. These findings, on balance, suggest an attenuated decline in PAEE was associated with more favourable changes in blood lipids in individuals who were overweight, possibly mediated by increased PAEE-induced activity of lipoprotein lipase during CR. Though research is needed to examine the mechanisms involved and how alterations in PAEE differentially alters healthspan in individuals who are normal weight and overweight, this could potentially imply that preserving PAEE during CR exerts greater improvements in cardiovascular disease risk in individuals who are overweight.
Changes in metabolic efficiency [13], macronutrient intake [42], thermoregulation, the thermic effect of food, and arousal [23] could affect variations in PAEE during CR, highlighting the variety of factors affecting PAEE. Similarly, any improvement in insulin sensitivity, lipid metabolism, and strength induced by elevations in PAEE during CR could be the result of greater intrinsic metabolic efficiency, mitochondrial capacity, and muscle quality. It is likely, however, the amount PA also had a significant influence on PAEE. We observed that participants who self-reported an increase in minutes/day of PA during CR exhibited an attenuated decline in PAEE. These findings may speculatively imply that individuals without obesity who maintain higher levels of PAEE by increasing their time engaged in PA display relative improvements in strength and certain cardiometabolic health markers during CR. Moreover, they suggest that increasing PA time during CR could be an inexpensive strategy that decreases potential drawbacks of CR and further decreases disease risk. Our research does not allow us to infer what (if any) PA strategies are effective during CR in cohorts like CALERIE™ phase 2, but increasing moderate to vigorous activity, reducing sedentary time, or incorporating resistance training during both structured exercise and leisure-time physical activity may be approaches that help bolster improvements in strength and markers of metabolism during CR. Further work is needed to test the causal link between PA, PAEE, and markers of healthspan during CR, particularly given the observational nature of this analysis and the many factors influencing PAEE.
Our novel findings may help develop CR regimens that facilitate the prevention of functional decline and cardiometabolic diseases in metabolically healthy populations, yet we should note that the clinical implications of our results are equivocal given the small associations detected. For instance, using previous evidence [43], it can be estimated that a 0.032–0.096 reduction in HOMA-IR associated with an increase in PAEE of 100–300 kcal/day would reduce the relative risk of type 2 diabetes by approximately 1.9–5.5%. Though it is possible that enhancing PAEE during CR reduces type 2 diabetes and cardiometabolic disease risk through other mechanisms (e.g., inflammation) [44] and these relationships could confer significant benefits at the population level, this clinical significance is small for an individual and further work is needed to determine if elevations in PAEE and PA during CR exerts a significant improvement in long-term disease risk in healthy individuals. Research is likewise needed to elucidate how healthspan markers are affected by the interplay between PAEE and CR. This is in light of the positive association between PAEE change and energy intake change, which potentially implies that elevations in PAEE during may attenuate the degree of energy restriction achieved during CR regimens.
A strength of this analysis is that data were collected during a well-controlled 2-year CR trial, but there are limitations. First, while this analysis was post-hoc, research is needed to determine the causal relationships between PAEE and outcomes. Second, the sample size may have been too small to detect certain relationships. Third, PA minutes/day data were self-reported, introducing inherent limitations linked to recall and desirability bias [45], which may explain the small (albeit significant) association between PAEE residual change and PA change. This means objective measures like accelerometery should be used to replicate our findings. Finally, food diaries were used to estimate RQ for calculating TDEE, potentially adding error to estimates of PAEE, which is common when estimating PAEE and PAL [21, 23]. Nonetheless, the use of DLW remains a strength because it is the gold standard assessment of free-living TDEE [46], and the resources used in CALERIE™ phase 2 are exceptional.
To conclude, in individuals without obesity, a smaller reduction in PAEE during a prolonged CR regimen was associated with small yet significant improvements in grip strength, insulin resistance, HDL-C, and minutes of PA. Although work is needed to establish the clinical relevance of our findings and pinpoint approaches that optimize the benefits of CR, our findings may indicate that strategies which sustain PAEE, such as PA, could improve several indicators of healthspan in healthy individuals who adopt prolonged CR, potentially assisting the prevention of functional decline and cardiometabolic diseases.
Supplementary Information
Supplementary Material 1.