
What this is
- The study investigates how placental mTOR signaling affects fetal development and metabolic health.
- Using a mouse model with placental mTOR deficiency, the research examines mitochondrial function, nutrient transport, and pancreatic beta cell development.
- Findings reveal that placental mTOR deficiency leads to fetal growth restriction (FGR) and altered beta cell characteristics.
Essence
- Placental mTOR deficiency in mice causes FGR and alters nutrient transport, impacting beta cell development and metabolic health in offspring.
Key takeaways
- Placental mTOR deficiency results in FGR, with reduced fetal insulin levels and increased beta cell size and proliferation in female fetuses.
- Despite smaller placentas, female mTORKO placentas exhibit increased expression of amino acid transporters and leucine flux, indicating altered nutrient transport.
- Adult female offspring from mTORKO mothers show heightened susceptibility to obesity and insulin resistance, suggesting long-term metabolic consequences.
Caveats
- The study's findings are based on a mouse model, which may not fully replicate human conditions of FGR and metabolic health.
- Statistical significance in some comparisons, particularly regarding male placentas, was not achieved, indicating potential variability in responses.
Simplified
Introduction
Decades of evidence link in utero factors with shaping risk for obesity and type 2 diabetes [1 –3]. Fetal growth restriction (FGR) is a determinant of adverse long-term health. FGR occurs when a fetus fails to reach its genetic growth potential, often due to placental insufficiency [4]. Mechanistic target of rapamycin (mTOR) is a nutrient sensor kinase that is commonly downregulated in FGR placentas and upregulated during fetal overgrowth [5 –7]. Our previous research demonstrated that placenta-specific mTOR deficiency significantly reduces fetal weight, mimicking an FGR phenotype [8]. Adult female offspring with reduced placental mTOR displayed exacerbated obesity and glucose metabolism dysfunction [8]. A strong correlation between placental mTOR status and offspring metabolic health trajectory has been established [4].
Placental mitochondrial dysfunction is implicated in pregnancy complications, including FGR [9]. Inhibition of mTOR by siRNA results in mitochondrial mass deficits and dysfunction in primary human trophoblasts [10]. The impact of placental mTOR deficiency on mitochondrial function in vivo remains undefined. Placental nutrient transport is a key factor in proper fetal growth. Ex vivo studies have shown that placental mTOR inhibition reduces amino acid transport, correlating with FGR [11 –13]. Most amino acid uptake is modulated by amino acid transporter systems [12], including system L and system A. Glucose transport is another major determinant of adequate growth [13, 14]. Positive associations between placental mTOR signalling, nutrient transporters, and fetal growth have been reported [6, 7, 15]. However, the consequences of direct placental mTOR manipulation on nutrient transport in vivo have not been elucidated.
Nutrient perturbations impair neonatal beta cell mass and glucose tolerance in adulthood [2, 3, 16, 17]. Suboptimal nutrient availability can impact critical beta cell proteins [18, 19] and beta cells are particularly sensitive to nutrient flux early in life [20]. Therefore, proper neonatal beta cell function may determine long-term responses to various nutrient environments. In the present study, we aimed to determine whether placental mTOR deficiency in vivo alters mitochondrial function and nutrient transport, and to test the hypothesis that placental mTOR deficiency perturbs nutrient flux to the fetus and impacts neonatal beta cell mass and function, negatively influencing long-term metabolic health.
Methods
Mouse model
A mouse model with loss of placental mTOR signalling was generated as previously reported [8]. Cyp19-cre recombinase [21] was used with loxP-flanked sites in the Mtor gene (Jackson Laboratory, strain #011009). Each litter comprises Cyp19-cre-positive and Cyp19-cre-negative offspring, used as littermate controls. Details are provided in the electronic supplementary materials (ESM Methods). Animal studies were performed in accordance with the University of Minnesota Institutional Animal Care and Use Committee (IACUC: protocol 2106–39213). Our study examined male and female placentas/neonates and found sex differences in the parameters measured; sex was therefore included as a biological variable in our analyses.
Embryonic tissue collection and processing
The presence of a copulation plug indicates embryonic day 0.5 (e0.5). Placentas containing maternal decidua and embryonic pancreas were collected for RNA and protein extraction or paraffin embedding. Paraffin-embedded tissues were sectioned at a thickness of 5 µm through the entirety of the pancreas.
BeWo cells and rapamycin treatment
Human placental choriocarcinoma BeWo cells were gifted by S. Wernimont (University of Minnesota), authenticated, and checked for mycoplasma contamination. Culture conditions are given in ESM. Rapamycin treatment at 30 or 100 nmol/l concentration was applied for 24 h before collection. Methods
Human placenta collection and processing
Placenta tissue samples were collected with the oversight of the University of Minnesota centralised biorepository and bioregistry for patient consent (BioNet) and under the approval of the University of Minnesota Institutional Review Board (IRB number STUDY00011993). Clinical characteristics and collection/processing details are given in ESM Table. 1
Mouse trophoblast isolation and bulk RNA sequencing
Mouse placenta tissues were digested using HBSS+ cations, 30 μg/ml DNase 1, 2.5% trypsin, 1 mg/ml collagenase, at 37°C, followed by filtering through a cell strainer, erythrocyte lysis and resuspension of cells in FACS buffer. Cells were submitted to the University of Minnesota Flow Cytometry Resource for GFP+ cell sorting, and collected for RNA isolation using RNeasy Plus Micro kits (Qiagen). Bulk RNA sequencing procedures and analysis details are provided in ESM. Methods
Quantitative RT-PCR
RNA samples were prepared using TRIzol with chloroform and quantified using a Nanodrop spectrophotometer (Thermo Scientific). A high-capacity cDNA reverse transcription kit (Applied Biosystems) was used for cDNA conversion. PCR was performed using the Applied Biosystems Q6 machine and SYBR Green reagent. β-Actin was used as the reference gene. Primer sequences are given in ESM Table. 2
Western blotting
Placentas or BeWo cells were lysed by homogenisation in RIPA buffer containing 1% SDS and protease and phosphatase inhibitors. Following BCA assay, 35 μg protein placental lysate or 50 μg BeWo cell lysate was resolved by SDS–PAGE, transferred to PVDF membrane, blocked with 5% non-fat dry milk, and incubated with primary antibodies overnight, prior to treatment with HRP-conjugated secondary antibodies. The primary antibodies are listed in ESM Methods. Blots were visualised using SuperSignal West Pico PLUS (Thermo Scientific), according to the manufacturer's instructions. Densitometry analysis was performed using Fiji ImageJ software (https://imagej.net/software/fiji/downloads↗).
Seahorse and mitochondrial mass
Frozen mouse placenta
A previously published protocol for mitochondria isolation and Seahorse analysis from previously frozen tissues was followed [22]. Sample and drug preparation details are given in ESM Methods. Mitochondrial respiration was measured using a Seahorse XFe96 Extracellular Flux analyser (Agilent Technologies).
Primary mouse trophoblasts and BeWo cell line
Primary mouse trophoblasts were isolated using a previously published method [23]. Briefly, mouse placentas were digested, and cell types were separated by Percoll gradient and centrifugation steps. Trophoblasts isolated from mTOR knockout (MTORKO) and control placentas were plated onto Seahorse XF96 plates for 48 h. BeWo cells were plated into Seahorse XFe96 plates and treated with 30 or 100 nmol/l rapamycin or DMSO vehicle for 24 h. Following treatment, the medium was switched to Seahorse assay medium. Mitochondrial respiration was measured using the Seahorse XF Cell Mito Stress Test kit for the Seahorse XFe96 Extracellular Flux analyser (Agilent Technologies). Oxygen consumption rate measurements were normalised to DNA concentration using a Quant-iT PicoGreen dsDNA kit.
To measure mitochondrial mass, total DNA was isolated from placentas using a QIAamp DNA Micro kit. Quantitative RT-PCR using primers flanking the mouse nuclear gene β2-microglobulin or mouse mitochondrial DNA (mtDNA) sequence was used to measure relative expression [24].
Transmission electron microscopy
Mouse placenta biopsy punchouts were collected and fixed, and then sectioned using a diamond knife on a Leica Ultracut UCT microtome at a thickness of 70–100μm, and stained using 3% aqueous uranyl acetate and Sato's lead citrate stain. Grids were imaged on a Philips CM12 transmission electron microscope at 60 kV at the University of Minnesota Imaging Center. Images were captured throughout the placenta at 3000× and 10,000× magnification to clearly identify nuclei, cell boundaries and mitochondria. Manual counting of mitochondria and size binning using Fiji ImageJ software were performed in n=5–8 cells per placenta.
Immunostaining
Paraffin-embedded placentas were sectioned and immunostained using a rabbit-specific HRP/DAB (ABC) Detection IHC kit (Abcam), according to the manufacturer's instructions. Primary antibodies with corresponding dilution factors are listed in ESM Table. Analysis details are given in ESM. 3 Methods
Paraffin-embedded pancreas sections were immunostained as previously described [8, 25]. Primary antibodies with dilution factors are given in ESM Table 3. Visualisation and imaging were performed using a Keyence fluorescence microscope at the indicated magnifications. Analysis of beta and alpha cell mass was performed as previously described [25]. Details are provided in ESM Methods.
Leucine and glucose flux
Dams were catheterised via the jugular vein. For measurement of leucine flux, 3,700,000 Bq 3H-leucine in physiological saline (154 mmol/l NaCl) was administered under isoflurane anaesthesia for 10 min [8]. For measurement of glucose flux, 3,700,000 Bq non-metabolisable 3H-methyl-d-glucose in physiological saline was administered under isoflurane anaesthesia for 3 min [26, 27]. Dams were killed by cervical dislocation. Prior to injection, and 3 and 10 min after glucose or leucine injection, respectively, maternal serum was collected to confirm 3H circulation. Placentas and fetuses were rapidly harvested, digested in Biosol, and then Bioscint was added (both National Diagnostics). Digested fetal tissue was diluted 1:5 for accurate measurement on the TriCarb liquid scintillation counter (Perkin Elmer). Disintegrations per minute were measured, and used to calculate leucine or glucose transfer relative to placental weight or fetal weight. Fold change was calculated relative to same-sex littermate control animals in each litter (n=6 dams for leucine and n=3 dams for glucose). Outliers were identified on the basis of being outside the upper and lower limits of the IQR.
Glucose- and leucine-stimulated insulin secretion
Islets were isolated from 7-day-old neonates by collagenase digestion. Following overnight rest, islets were prepared as previously described [28, 29]. Details for static and dynamic glucose-stimulated insulin secretion (GSIS) conditions are given in ESM Methods. Dynamic leucine-stimulated insulin secretion (LSIS) was also measured in combination with glucose conditions. Insulin concentrations were determined using Ultrasensitive Mouse Insulin ELISA kits (ALPCO) and normalised by DNA determined using a PicoGreen dsDNA assay.
Amino acid treatment of embryonic pancreas explants
Pancreases were harvested from wild-type fetuses at e17.5 and cultured for 72 h in control, branched chain amino acid (BCAA) or system A amino acid (SNAT AA) medium. Details for the culture media and conditions are given in ESM. Media were changed every 24 h. After 72 h incubation with control medium, BCAA medium or SNAT AA medium, explants were fixed, processed and embedded. Sectioning, staining and analyses were executed as described above and in ESM. Methods Methods
Statistical analysis
Data are presented as mean ± SEM. Placental weights, fetal weights and placental efficiency were analysed using two-way ANOVA, with sex and genotypes as factors, and by Sidak's multiple comparisons test. Expression data were analysed using an unpaired, two-tailed t test or one-way ANOVA with Tukey post hoc test. Beta cell, alpha cell and other staining were analysed using an unpaired, two-tailed t test. Static GSIS experiments were analysed using two-way ANOVA with Sidak's multiple comparisons test or an unpaired, two-tailed t test. Dynamic GSIS/LSIS experiments were analysed using the area under curve followed by unpaired, two-tailed t test. Analyses and data visualisation were performed in GraphPad PRISM version 8. The significance threshold was p<0.05.
Results
Placental mTOR deficiency causes FGR in mice
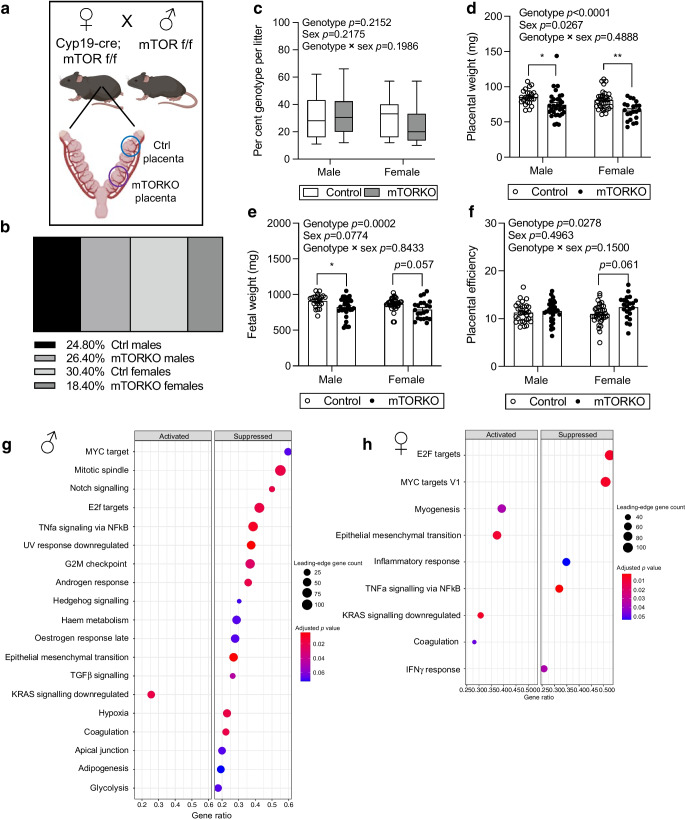
Reduction of placental mTOR was confirmed in mTORKO placentas (ESM Fig. 1f; genotype effect p=0.0004, genotype × sex interaction p=0.0774). The degree of mTOR inhibition was comparable in male and female mTORKO placentas (ESM Fig. 1f). Notably, mTOR was not statistically significantly reduced in the male placentas when analysed using multiple comparisons (p=0.0983), whereas female placentas displayed a significant reduction (ESM Fig. 1f). Bulk RNA sequencing of isolated trophoblasts from control and mTORKO placentas revealed that mTOR mediation of cell signalling pathways was distinct in each sex. In male mTORKO placentas, Notch signalling, TGFβ signalling, hormone responses and hypoxia were significantly decreased (Fig. 1g). In female mTORKO placentas, cell replication and inflammation pathways were significantly decreased, while epithelial mesenchymal transition signalling was increased (Fig. 1h). TNFα signalling by NF-κB was suppressed and Kirsten rat sarcoma viral oncogene homologue (KRAS) signalling was increased in both male and female mTORKO placentas (Fig. 1g, h). These findings highlight the myriad disruptions induced by mTOR deficiency in the placenta.

Placental mTOR deficiency results in FGR. () Breeding scheme and possible placental genotypes within a litter. () Sex and genotype proportions in e17.5 litters. () Proportion of each genotype by sex per litter. () Weight of control and mTORKO male and female placentas (=21–35). () Weight of control and mTORKOmale and female fetuses (=22–34). () Placental efficiency for control and mTORKOmale and female offspring determined by fetal weight divided by placental weight (=22–35). (,) Dot plots from gene set enrichment analyses (GSEA) comparing trophoblasts from () male and () female control and mTORKO placentas. Statistical analyses were performed using two-way ANOVA, with sex and genotype as factors. Asterisks indicate significance: *<0.05, **<0.01. Ctrl, control a b c d e f g h g h n n n p p pl pl
Mitochondrial dysfunction and suboptimal ultrastructure in the mTORKO placenta
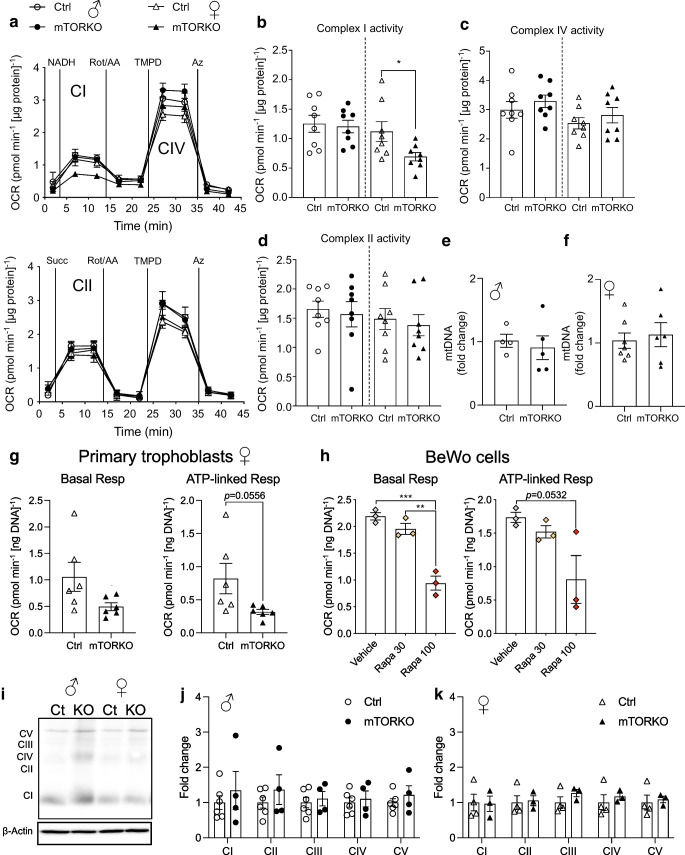
To complement our findings in frozen tissue, we assessed mitochondrial function in primary mouse trophoblasts isolated from control and mTORKO placentas. This method allows assessment of the live cell oxygen consumption rate. We found decreases in basal and ATP-linked respiration in female mTORKO trophoblasts, but these did not reach statistical significance (p=0.0752 and p=0.0556, respectively) (Fig. 2g). No differences in basal or ATP-linked respiration were detected in male mTORKO trophoblasts (ESM Fig. 2d). We validated the mTOR–mitochondria relationship using the BeWo cell line. Treatment with 30 or 100 nmol/l rapamycin for 24 h reduced mTOR signalling to 37% and 22% of control levels, respectively (ESM Fig. 2e, f). mtDNA content was not statistically different in 30 nmol/l rapamycin-treated cells (p=0.072) or 100 nmol/l rapamycin-treated cells (p=0.09) compared with control (ESM Fig. 2g). The live cell oxygen consumption rate was significantly blunted in BeWo cells treated with 100nmol/l rapamycin (ESM Fig. 2h). As in mTORKO primary trophoblasts, deficits in basal and ATP-linked respiration (Fig. 2h) were detected in BeWo cells with inhibited mTOR signalling. Maximum respiration, proton leak, space capacity and non-mitochondrial respiration were unchanged (ESM Fig. 2i–l). These live cell data suggest that mTOR inhibition in placental cells results in reduced ATP production.
Protein expression of oxidative phosphorylation complexes I–V was not different by genotype in either sex (Fig. 2i–k). However, gene expression of regulators of mitochondrial genome transcription (Tfam), dynamics (Mfn1 and Mfn2), oxidative stress (Nrf2) and energy metabolism (Pparg) was increased in male mTORKO placentas, but not female mTORKO placentas (ESM Fig. 2m, n).

Mitochondrial function in the mTOR-deficient placenta. () Seahorse traces, with quantification of () complex I activity, () complex IV activity, and () complex II activity in control and mTORKO male and female placentas (=7–8). Circles, male; triangles, female. (,) Mitochondrial mass quantified by mtDNA in () male and () female placentas of control and mTORKO mice (=4–7). () Quantification of basal respiration and ATP-linked respiration in primary trophoblasts isolated from female control and mTORKO placentas (=6). () Quantification of basal respiration and ATP-linked respiration in BeWo cells in response to treatment with 30 or 100 nmol/l rapamycin (Rapa 30/Rapa 100) (=3). (–) Western blot () and quantification of total oxidative phosphorylation complexes in () male and () female placentas of control and mTORKO mice (=3–6). Statistical analyses were performed using an unpaired two-tailedtest or one-way ANOVA with Tukey's post hoc test. Asterisks indicate significance: *<0.05, **<0.01, ***<0.001. AA, amino acid; Az, azide; CI, complex I; CII, complex II; CIV, complex IV; Ct or Ctrl, control; OCR, oxygen consumption rate; Resp, respiration; Rot, rotenone; Succ, succinate; TMPD, tetramethylphenylenediamine a b c d e f e f g h i k i j k n n n n n t p p p

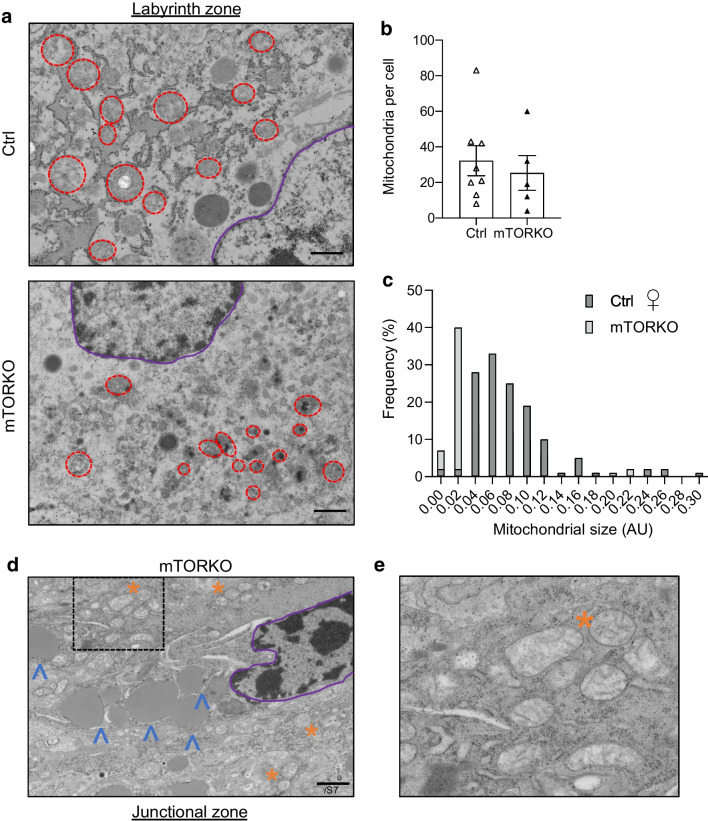
Mitochondrial morphology in the mTOR-deficient placenta. () Representative ×10,000 images of the labyrinth zone of control and mTORKO female placentas. Representative mitochondria are circled in red; the nucleus is outlined in purple. () Quantification of mitochondria per cell (=5–8). () Frequency of each size of mitochondria in control and mTORKO female placentas. AU, arbitrary units. () ×10,000 images of the junctional zone in a female mTORKO placenta. Electron-transparent mitochondria are indicated by orange asterisks, with a magnified image in (); lipid accumulation is indicated by blue arrowheads. Scale bar, 1 μm. Statistical analyses were performed using an unpaired two-tailedtest with significance set at<0.05 (no significant findings in the figure). Ctrl, control a b c d e n t p
Glucose transporter expression and flux in the mTORKO placenta
To understand alterations in nutrient transport in mTORKO placentas, glucose transporter expression and flux were measured. There was an increase in Slc2a1 (GLUT1) in male mTORKO placentas (p=0.0554) and female mTORKO placentas (ESM Fig. 3a, b). We measured unidirectional flux using 3H-labelled glucose. We found no differences by genotype in terms of glucose detected in the male or female fetuses (ESM Fig. 3c, e) or placentas (ESM Fig. 3d, e). We noted significantly increased glycogen cell numbers in the junctional zone of the mTORKO male placentas (ESM Fig. 3f, g) and female placentas (ESM Fig. 3h, i).
Elevated system A expression in the mTORKO placenta

Elevated expression in late gestation. () Expression of(SNAT1),(SNAT2) and(SNAT4) in male mTORKO placentas and littermate control placentas (=6–11). () Expression of(SNAT1),(SNAT2) and(SNAT4) in female mTORKO placentas and littermate control placentas (=9–10). () Western blot for SNAT1 expression in mTORKO placentas. Vinculin is used as a loading control. (,) Quantification of the SNAT1 blot for () male mTORKO placentas compared with littermate control placentas (=6) and () female mTORKO placentas compared with littermate control placentas (=3–4). () Quantification of whole-placenta SNAT1 immunohistochemistry staining for female mTORKO placentas and littermate controls (=5–6). () ×60 images of SNAT1 immunohistochemistry staining by zone in female control and mTORKO placentas. Scale bar, 52.8 μm. (,) Quantification for () the labyrinth zone and () the junctional zone (=5–6); normalised to female control placentas using fold-change analysis. (,) Quantification () and images () of a western blot measuring SNAT1 expression in BeWo cells treated with 30 or 100 nmol/l rapamycin (Rapa 30/Rapa 100) (=3). (,) Images () and quantification () of a western blot measuring SNAT1 expression in human AGA and FGR placentas (=4–6). Statistical analyses were performed using an unpaired two-tailedtest or one-way ANOVA with Tukey's post hoc test. Asterisks indicate significance: *<0.05, **<0.01, ***<0.001. Browning indicates the intensity of 3,3′-diaminobenzidine (DAB) staining. Ct or Ctrl, control a b c d e d e f g h i h i j k j k l m l m Slc38a1 Slc38a2 Slc38a4 n Slc38a1 Slc38a2 Slc38a4 n n n n n n n t p p p
Increased system L expression and flux in the mTORKO placenta

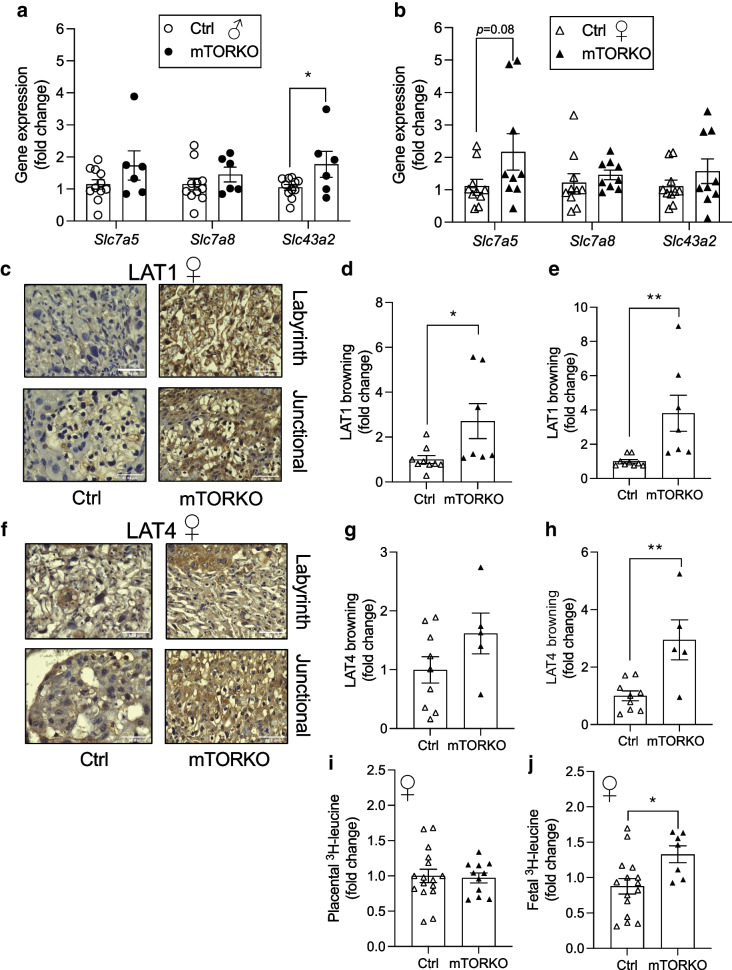
Increased expression of system L subunits in late gestation. () Expression of(LAT1),(LAT2) and(LAT4) in male mTORKO placentas and littermate control placentas (=6–11). () Expression of(LAT1),(LAT2) and(LAT4) in female mTORKO placentas and littermate control placentas (=9–10). () ×60 images of LAT1 immunohistochemistry staining by zone in female control and mTORKO placentas. Scale bar, 52.8 μm. (,) Quantification for () the labyrinth zone and () the junctional zone (=7–9) normalised to female control placenta using fold-change analysis. () ×60 images of LAT4 immunohistochemistry staining by zone in female control and mTORKO placentas. Scale bar, 52.8 μm. Quantification for () the labyrinth zone and () the junctional zone (=5–9) normalised to female control placenta using fold-change analysis. (,)H-leucine detected in female placentas (=11–17) () and fetuses (=7–15) () following administration to maternal circulation. Statistical analyses were performed using an unpaired two-tailedtest. Asterisks indicate significance: *<0.05, **<0.01. Browning indicates the intensity of 3,3′-diaminobenzidine (DAB) staining. Ctrl, control a b c d e d e f g h i j i j Slc7a5 Slc7a8 Slc43a2 n Slc7a5 Slc7a8 Slc43a2 n n n n n t p p 3

Increased expression of system L subunits in human FGR. () ×10 images and quantification of LAT1 immunohistochemistry staining in human AGA and FGR placentas (=3–5). () ×10 images and quantification of LAT4 immunohistochemistry staining in human AGA and FGR placentas (=3–4). Scale bar, 500 μm. Browning indicates the intensity of 3,3′-diaminobenzidine (DAB) staining. Statistical analyses were performed using an unpaired two-tailedtest. Asterisks indicate significance: *<0.05, **<0.01 a b n n t p p
Beta cell function in neonatal offspring exposed to placental mTOR deficiency
Static GSIS experiments assessed islet responses to low glucose (2 mmol/l, LG) and high glucose (16.7mmol/l, HG), with no differences in insulin secretion by genotype being observed (Fig. 7c, d). Dynamic GSIS experiments assessed insulin secretion in response to glucose and leucine at higher resolution. In neonates there is a critical transition from amino acids to glucose as the main stimulus of insulin secretion [33]. We aimed to determine whether this transition was disrupted in mTORKOpl offspring. Across sexes and genotypes, basal insulin secretion in response to LG (2 mmol/l) was not different (ESM Fig. 5c, d), nor was insulin secretion in response to LG + leucine (Fig. 7e, f and ESM Fig. 5e), high glucose only (HG, 16.7mmol/l) (Fig. 7g, h and ESM Fig. 5f) or HG + leucine (Fig. 7i, j, ESM Fig. 5f) in male or female offspring. Islet insulin content was comparable between mTORKOpl offspring and their respective littermate controls (ESM Fig. 5g, h).

Neonatal GSIS differences in male and female mTORKOoffspring. (,) Serum insulin levels in late-gestation (e17.5) control and mTORKOmale fetuses (=9–18) () and female fetuses (=6–15) (). (,) Static GSIS in response to low (LG, 2 mmol/l) and high (HG, 16.7 mmol/l) glucose concentrations in control and mTORKOmale neonates (=5–8) () and control and mTORKOfemale neonates (=4–6) () presented as % insulin content. (,) Dynamic GSIS in response to low glucose (LG, 2 mmol/l) supplemented with-leucine (1 mmol/l) in control and mTORKOmale () and female () neonates, presented as the AUC. (,) Dynamic GSIS in response to high glucose (HG, 16.7 mmol/l) in control and mTORKOmale () and female () neonates, presented as the AUC. (,) Dynamic GSIS in response to HG supplemented with leucine (1 mmol/l) in control and mTORKOmale () and female () neonates, presented as the AUC stimulation ratio. Statistical analyses were performed using an unpaired two-tailedtest or two-way ANOVA with Sidak's multiple comparisons test. Asterisks indicate significance: *<0.05, **<0.01. Ctrl, control pl pl pl pl pl pl pl a b a b c d c d e f e f g h g h i j i j n n n n t p p l
Increased average beta cell size and proliferation in neonatal female mice exposed to placental mTOR deficiency
We next assessed whether increasing BCAAs (leucine, isoleucine, valine), which are transported through system L, or amino acids that are transported through SNAT AAs (glutamine, alanine, serine) was sufficient to increase beta cell proliferation during late gestation (e17.5). After 3 days of culture with BCAAs, the embryonic pancreas did not display increased proliferation in insulin-positive cells (Fig. 8h, i). Leu, a BCAA and a potent activator of mTOR signalling, has been shown to reduce beta cell differentiation, while mTORC1, through genetic deletion, is reported to be required for pancreatic progenitor development [34, 35]. We did not observe any differences in beta cell mTOR signalling measured by phosphorylated S6 or Pdx1 expression in female mTORKOpl fetuses (ESM Fig. 6d, e), which bolsters our finding that increased BCAAs are not sufficient to increase beta cell proliferation in our mTORKOpl offspring. Culture with SNAT AA medium for 3 days significantly increased proliferation of insulin-positive cells in the embryonic pancreas (Fig. 8j, k).

Increased average beta cell size and proliferation in mTORKOfemale fetuses. () Representative images of islets stained for insulin (Ins; green) and glucagon (Gcg; red) from female littermate control and mTORKOfetuses (e17.5). Scale bar, 50 μm. (,) Quantification of beta cell mass (=11–12) () and alpha cell mass (=8) (). () Average beta cell size (=11–12). () Representative ×60 images of the Ki67 proliferation marker in insulin-positive cells in female littermate control and mTORKOfetuses (e17.5). Scale bar, 50 μm. Arrows indicate representative proliferating insulin-positive cells included in analyses. () Quantification of Ki67 in insulin-positive cells (=4–5). () Pancreas weight normalised by body weight (BW) in female littermate control and mTORKOe17.5 fetuses (=11–19). (,) Representative ×60 images () and quantification () of Ki67 proliferation of insulin-positive cells in wild-type pancreas explants incubated with BCAA medium or control medium for 72 h. Scale bar. 50 μm. (,) Representative ×60 images () and quantification () of Ki67 proliferation of insulin-positive cells in wild-type pancreas explants incubated with SNAT AAs or control medium for 72 h. Scale bar. 50 μm. (,) Arrows indicate insulin-positive beta cells. Statistical analyses were performed using an unpaired two-tailedtest. Asterisks indicate significance: *<0.05. Ctrl, control pl pl pl pl a b c b c d e f g h i h i j k j k h j n n n n n t p
Discussion
We have demonstrated that placental mTOR deficiency in vivo increases placental amino acid and glucose transporter systems and leucine flux in late-gestation female fetuses only, despite the presence of FGR in our mouse model. Upregulation of nutrient transporters was paradoxically associated with decreased mitochondria function in the female mTORKO placentas. Female mTORKOpl fetuses displayed significantly reduced circulating insulin without perturbations in neonatal islet insulin secretion. Average beta cell size and proliferation were elevated in female mTORKOpl fetuses, which may contribute to increased susceptibility to type 2 diabetes. Collectively, our study reveals a vital role for mTOR signalling in the modulation of placental function, the fetal nutrient environment and early-life offspring beta cell programming.
Mitochondrial function is important for placental development and optimal function. Previous studies have shown that mTORC1 reduction in primary human trophoblasts leads to defects in mitochondrial biogenesis [10]. Our findings of complex I-specific dysfunction, reduced ATP production, electron-transparent mitochondria and disorganised ultrastructure morphology in the female mTORKO placenta align with a poorly functioning placenta. The presence of electron-transparent mitochondria may indicate electron leakage, which may create reactive oxygen species and accelerate cell ageing and damage [30]. One study reported that electron leaks in smooth muscle cells are the result of complex I dysfunction specifically contributing to production of reactive oxygen species [36]. Mitochondrial dysfunction and reactive oxygen species–antioxidant pathways increase glycogen cell accumulation and triacylglycerol nutrient stores in the placenta [37], as seen in the mTORKO placenta. Little is known about mTOR regulation of glycogen cell accumulation and migration. Due to unchanged glucose transport in our model, we speculate that there is an mTOR-mediated delay in glycogen cell migration into the maternal decidua.
Increased amino acid transporter levels and flux in the mTOR-deficient placenta are contrary to many previous reports [7, 11, 13, 38], which made use of primary human trophoblasts and placental villous explants post-birth, and thus may not recapitulate the intrauterine environment. Human studies of FGR report reduced transplacental leucine flux [39]. However, mTOR status in these samples is unknown. Our current study is the first to assess nutrient transport in placentas with mTOR deficiency in vivo and to determine direct consequences on the developing metabolic tissues in the fetus.
Leucine treatment impairs beta cell progenitor proliferation and development when given during pancreatic bud maturation [34]. Reports of leucine lowering insulin expression [34] and increasing proliferation in Pdx1+ progenitor cells [35] suggest its role in beta cell development. These studies implicate mTOR signalling in leucine-mediated proliferation. Beta cell mTOR signalling is a key regulator of cell growth and insulin secretion [40, 41], and governs beta cell nutrient sensing transition during the neonatal period [41]. Despite increased leucine flux in our model, beta cell mTOR signalling was not altered, thus, in these cells, mTOR nutrient sensing does not account for the increased beta cell size or proliferation in female mTORKOpl fetuses.
The impact of SNAT AAs on beta cell proliferation is less well understood. Glutamine amplifies insulin secretion [42] and indirectly enhances beta cell proliferation in primary adult islets [43], but has an unknown impact during development. Incubation of pancreatic bud explants with alanine does not affect proliferation [34], but the effect of alanine in late gestation is unstudied. Incubation of postnatal day 28 beta cells with serine significantly increased beta cell proliferation [44], but the consequences of increased fetal serine on beta cell proliferation are unknown. In our study, fetal pancreas explants were treated with a combination of SNAT AAs to test their capacity to induce proliferation. We show for the first time that SNAT AAs are sufficient to increase beta cell proliferation during late gestation and may negatively impact beta cell development.
Despite increased beta cell size and proliferation in female mTORKOpl fetuses, circulating insulin was lower in late gestation. An early increase in beta cell proliferation in response to nutrient stress can indicate immaturity [45, 46] and lead to early exhaustion [47, 48], which may be underlying long-term beta cell adaptation defects in mTORKOpl female offspring. Additionally, decreased fetal insulin may partially contribute to the FGR phenotype in our model due to its role in promoting growth. We have demonstrated that placental mTOR deficiency is sufficient to induce FGR. However, our data suggest a compensation in amino acid transport in late gestation that has not been reported in humans. It is unlikely that direct deletion of placental mTOR physiologically recapitulates the complexity of human FGR. One limitation of our study is the non-statistically significant decrease in mTOR expression in the male mTORKO placenta. As such, the distinct phenotypes observed in mice of each sex during the neonatal period and adulthood [8] warrant further investigation and substantiation in humans. Understanding the determinants of long-term metabolic health will provide a more accurate picture of how biology and environment interact to influence fetal programming and metabolic health.
Supplementary Information
Below is the link to the electronic supplementary material. ESM (PDF 3339 KB)