
What this is
- This research investigates the role of PRDX5 in skeletal muscle, focusing on mitochondrial function and nuclear distribution during muscle development and aging.
- PRDX5 is essential for maintaining mitochondrial energy production and proper myonuclear distribution.
- The combined deficiency of PRDX3 and PRDX5 accelerates muscle aging, highlighting their cooperative roles in muscle health.
Essence
- PRDX5 regulates mitochondrial function and nuclear positioning during muscle development. Its deficiency, especially in combination with PRDX3, accelerates muscle aging and dysfunction.
Key takeaways
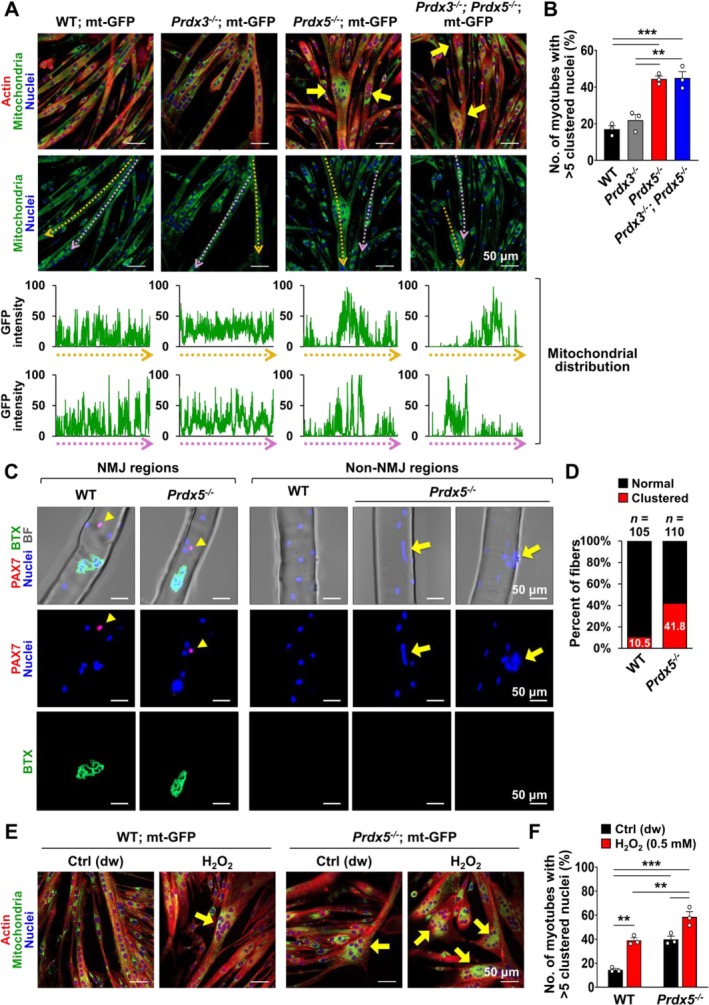
- PRDX5 deficiency leads to impaired nuclear spreading in myotubes, characterized by clustered nuclei. This was observed in myotubes derived from Prdx5-deficient mice, with 44.4% and 44.9% of myotubes showing clustered nuclei compared to 17.1% and 21.9% in wild-type and Prdx3 myotubes, respectively.
- Mitochondrial ATP production is significantly reduced in myotubes lacking PRDX5 and PRDX3. This reduction indicates a critical role for PRDX5 in maintaining mitochondrial function during muscle regeneration.
- The combined deficiency of PRDX3 and PRDX5 leads to accelerated muscle aging, marked by decreased muscle mass and strength, and increased expression of muscle proteolysis markers as early as 10 weeks of age.
Caveats
- The study primarily relies on mouse models, which may not fully replicate human muscle aging processes. Further research is needed to confirm these findings in human subjects.
- While the study establishes a link between PRDX5 deficiency and muscle aging, the exact mechanisms governing these effects require further investigation.
Definitions
- myogenesis: The process of muscle formation, involving the differentiation of myoblasts into myotubes.
- oxidative stress: An imbalance between reactive oxygen species production and the body's ability to detoxify them, leading to cellular damage.
Simplified
Introduction
Skeletal muscle is a highly dynamic tissue that relies on efficient mitochondrial function for proper development, regeneration and performance [1]. Mitochondria play a crucial role in energy production and redox homeostasis, both of which are essential for effective muscle contraction and recovery following injury [2, 3, 4]. However, mitochondria are also the primary source of reactive oxygen species (ROS), and excessive ROS production can lead to oxidative stress, which is widely recognized as a major contributor to muscle aging and sarcopenia, a condition characterized by the progressive loss of muscle mass and function in aging individuals [5, 6]. Elevated ROS levels, in turn, induce mitochondrial dysfunction, which has been reported to be associated with various muscle pathologies, including sarcopenia, muscular dystrophies and muscle dysfunction [4, 5, 6, 7, 8]. Therefore, effective antioxidant systems are crucial for neutralizing ROS and preserving mitochondrial health to prevent muscle degeneration during aging.
Mitochondria need to be properly transported and distributed within cells to meet localized energy demands, ensuring efficient ATP delivery and ROS detoxification to minimize oxidative damage [9, 10]. Mammalian mitochondrial Rho 1 (Miro1), an outer mitochondrial membrane protein, and Milton, an adaptor protein that links Miro1 to motor proteins, are key components of the mitochondrial transport process [11]. Specifically, Milton interacts with kinesin motors at one end and binds to Miro1 at the other, forming a complex that effectively loads mitochondria onto the kinesin transport machinery. This Miro1/Milton/kinesin complex facilitates the anterograde transport of mitochondria along the microtubule network for their proper distribution within cells [11]. The critical role of this transport system has been well established in the nervous system, where deficiencies in Miro1 or Milton have been associated with severe neurological diseases and impaired axonal outgrowth [12, 13]. While defective mitochondrial transport has been extensively studied in the context of neurological disorders [14], its significance in myotubes and myofibers, where proper mitochondrial distribution is likely crucial for preventing localized energy deficits and oxidative stress, remains largely unexplored.
During myogenesis, proper positioning of nuclei along the length of myotubes and myofibers is essential to ensure optimal transcriptional regulation and efficient cellular function [15, 16]. Throughout myotube formation, nuclei undergo a series of well‐coordinated movements, including centration and spreading [17]. Nuclear centration occurs immediately after myoblast fusion, during which nuclei migrate towards the center of the newly formed myotube. Following centration, nuclei undergo spreading along the longitudinal axis of the myotube to achieve an even distribution. This step is mediated by kinesin motor proteins, which transport nuclei apart towards the plus ends of microtubules, resulting in the uniform spacing of nuclei along the myotube [16, 17]. This even distribution of nuclei is crucial for adequately supporting the transcriptional and metabolic demands of the surrounding cytoplasm. Indeed, defective nuclear positioning has been linked to a range of muscle pathologies, including muscle dysfunction, muscular dystrophy and centronuclear myopathies [15, 16, 17, 18], indicating that precise nuclear positioning is fundamental for proper myotube formation and muscle function. Since transporting nuclei within muscle cells demands energy, the role of mitochondria is likely crucial. However, the influence of mitochondrial function and transport on nuclear distribution during myotube formation remains largely unknown, requiring further investigation.
Peroxiredoxins (PRDXs) are a family of antioxidant enzymes that play a central role in neutralizing H2O2 and maintaining cellular redox balance [19]. Among the six isoforms, PRDX3 and PRDX5 are unique in their localization to mitochondria, suggesting that they may have specialized functions in regulating mitochondrial function in muscle tissue. Previous studies have highlighted the role of PRDX3 in maintaining mitochondrial integrity and muscle contractile function [2, 20]. Notably, transgenic mice designed to overexpress Prdx3 specifically in muscle were shown to reverse mitochondrial dysfunction and prevent muscle wasting induced by oxidative stress [20]. In contrast to the relatively well‐documented functions of PRDX3 in muscle, the specific roles of PRDX5 in muscle remain largely unexplored. Recent evidence suggests that PRDX5 extends its functions beyond antioxidant activity by regulating gene expression through direct interactions with transcription factors in both the cytoplasm and nucleus [21, 22], raising the possibility that PRDX5 may regulate mitochondrial function and nuclear distribution in muscle cells through transcriptional mechanisms.
In this study, we investigated the role of PRDX5 in skeletal muscle by utilizing Prdx5−/− and Prdx3−/−; Prdx5−/− mouse models. We found that PRDX5 is essential for maintaining mitochondrial energy production, transport and proper myonuclear distribution during myogenesis and muscle regeneration. Mechanistically, PRDX5 promotes the expression of mitochondrial transport regulators Miro1 and Milton, which are crucial for effective mitochondrial transport and myonuclear spreading. Furthermore, we demonstrate that the combined deficiency of PRDX3 and PRDX5 leads to accelerated muscle aging, characterized by enhanced oxidative stress, mitochondrial dysfunction and muscle atrophy. Our findings reveal a previously unrecognized role of PRDX5 in regulating mitochondrial function and nuclear distribution in skeletal muscle and suggest that enhancing PRDX3 and PRDX5 function may represent a promising therapeutic strategy for preventing age‐related muscle degeneration.
Materials and Methods
Mice
All mice were maintained on a C57BL/6 J background, and all animal studies were approved by the Institutional Animal Care and Use Committees at Seoul National University. Prdx3−/− and Prdx5−/− mice have been previously described [23, 24]. Prdx3−/− and Prdx5−/− mice were crossed to generate Prdx3−/−; Prdx5−/− mice. Conditional mitochondria reporter mice, which express GFP in mitochondria upon crossing with Cre mice [25], were kindly provided by Jeremy Nathans (Johns Hopkins University School of Medicine, MD). EIIA‐Cre mice, which ubiquitously express Cre recombinase, were crossed with the conditional mitochondria reporter mice to obtain mt‐GFP mice. Subsequently, Prdx5−/− and Prdx3−/−; Prdx5−/− mice were crossed with mt‐GFP mice to generate Prdx5−/−; mt‐GFP and Prdx3−/−; Prdx5−/−; mt‐GFP mice, respectively. Genotyping primers are listed in Table S1.
Muscle Function
Maximal forelimb grip strength was measured using a Grip Strength Meter (Bioseb) according to the manufacturer's guidelines. Mice were allowed to grasp a metal bar using their forelimbs only and were pulled backward horizontally. The test was performed in five consecutive trials per session, and the highest recorded value was noted. Each mouse underwent three sessions, and the average of the three sessions was used for analysis. The running endurance test was conducted using a treadmill (JD‐A‐09, Jeungdo Bio & Plant), following a previously published protocol [26]. Briefly, the treadmill speed was increased by 2–3 m/min every 3 min, and the incline was raised by 5% at 6, 12 and 21 min after the start. Work was calculated as the product of force (mass × gravitational acceleration × sin [angle]) and speed.
Muscle Regeneration
Snake venom from Sepedon hemachatus (Sigma) was prepared as a 10‐μM solution and injected into the right gastrocnemius (GAS) and tibialis anterior (TA) muscles of 4‐week‐old mice under isoflurane anaesthesia. A total of 80 μL was administered into the GAS and 30 μL into the TA. Cross‐sections of the GAS muscle were prepared using a CM1860 cryostat (Leica Biosystems) and stained with either haematoxylin and eosin (H&E) or immunofluorescence. Immunofluorescence staining was performed using an anti–embryonic myosin heavy chain antibody (BF‐G6, DSHB; 1:20) and an anti–laminin antibody (L9393, Sigma; 1:500). H&E and immunofluorescence staining were conducted following the previous protocol [27]. Muscle regeneration was also assessed by analysing gene expression in regenerating TA muscles.
Dual‐Energy X‐Ray Absorptiometry
Dual‐energy x‐ray absorptiometry (DXA) scanning was performed using the InAlyzer scanner (Medikors), and analysis was conducted with InAlyzer software (Medikors) following the previously described method by our group [28].
In Vitro Myogenesis
Primary myoblasts were isolated using the preplating method. Briefly, muscle tissues (quadriceps, GAS, and TA) from adult mice were minced and digested in a mixture of Collagenase type IV (Gibco) and Dispase II (Gibco) for approximately 1 h on a rocker at 37°C. The cell suspension was then preplated on a plastic dish for 1 h, allowing fibroblasts to adhere while myoblasts remained in suspension. The supernatant containing myoblasts was transferred to a new dish for another 1‐h preplating step, which was repeated 5 times in total. After the final step, myoblasts were plated on a 0.1% gelatin‐coated dish. Myoblasts were expanded in F‐10 medium (Gibco) supplemented with 20% horse serum (Gibco), penicillin–streptomycin (Gibco) and 2.5 ng/mL fibroblast growth factor (FGF) basic (PeproTech). Differentiation into myotubes was induced by plating myoblasts onto glass‐bottom dishes or plates coated with 1 mg/mL Matrigel (Corning) in DMEM (Cytiva) containing 5% horse serum and penicillin–streptomycin. At 24 h of differentiation, myotubes were treated with either 0.5 mM H2O2 (Daejung) or 0.1 μM Oligomycin A (Sigma) to analyse nuclear clustering. Fixed myotubes were stained with Phalloidin probes (Invitrogen) to label actin and DAPI to visualize nuclei.
Transfection
For live imaging, myoblasts were transfected with a Map 7 or Lifeact plasmid tagged with mCherry using FuGENE HD (Promega) or Lipofectamine 3000 (Invitrogen) transfection reagent to label microtubules or actin filaments, respectively. The pCMV‐Map 7 plasmid was obtained from the Korea Human Gene Bank, Medical Genomics Research center, KRIBB, Korea. The pCMV‐mCherry‐Lifeact plasmid was kindly provided by Jin Man Kim (Seoul National University, Korea). pCMV‐Rhot1 and pCMV‐Trak1 plasmids (Origene; MR209606 and MR209421, respectively) were transfected using Lipofectamine 3000 (Invitrogen) reagent. For siRNA transfection, Lipofectamine RNAiMAX (Invitrogen) transfection reagent was used. Predesigned siRNAs (Bioneer) were used for siCtrl (SN‐1002), siRhot1 (59 040‐1) and siPrdx5 (54 683‐1). The sequences for siTrak1 (Bioneer) are as follows: Sense: GAUGACACAGGUGACCACA; Antisense: UGUGGUCACCUGUGUCAUC. All transfections were performed according to the manufacturer's protocol.
Single Myofiber Analysis
Single myofibers were isolated from extensor digitorum longus (EDL) muscles by digesting the tissue in 2 mg/mL Collagenase type 1 (Sigma) solution for approximately 1 h at 37°C. Digested tissues were then gently triturated using a wide‐bore pipette to release individual myofibers. Fibre immunostaining was performed following a previously published protocol with slight modifications [29]. Anti‐PAX7 antibody (DSHB; 1:50) and conjugated alpha‐bungarotoxin (Invitrogen; 1:100) were used to label satellite cells and neuromuscular junctions, respectively.
Fluorescence Imaging
Myoblasts, myotubes and muscle cross‐sections were imaged using the Zeiss LSM 800 confocal microscope (Zeiss) with or without Airyscan mode. Live imaging of myoblast differentiation was performed using Zeiss Axio Observer Z1 (Zeiss), Zeiss LSM 800 confocal microscope (Zeiss), Zeiss Elyra 7 with Lattice SIM (Zeiss), or Zeiss Lattice SIM 5 (Zeiss) and processed using the Zeiss Zen blue edition software (Zeiss). Tetramethylrhodamine (TMRM) and mitochondrial GFP intensities within defined regions of interest (Figure 4) were quantified using the Zeiss Zen blue edition software (Zeiss). TMRM signal intensity was normalized to the corresponding mitochondrial GFP signal. Mitochondrial GFP intensity profiles were generated using the Fiji software.
Mitochondrial Function Analysis
Mitochondrial membrane potential in myotubes or muscle cross‐sections was assessed after staining with 100 nM TMRM (Invitrogen) for 30 min at 37°C, following the manufacturer's protocol. Mitochondrial oxygen consumption rate (OCR) was measured using the Seahorse XFe96 Analyzer (Agilent) following the manufacturer's protocol and our previously described method [30]. After basal readings were recorded, 1.5 μM oligomycin, 0.5 μM FCCP and 0.5 μM rotenone/antimycin A were sequentially injected. All reagents were provided in the Cell Mito Stress Test Kit for XFe/XF Analyzers (Agilent). Seahorse data were normalized to protein content, which was measured using the Bradford assay. H2O2 production by isolated mitochondria was assessed using the Amplex Red Hydrogen Peroxide/Peroxidase Assay Kit (Invitrogen), following the manufacturer's instructions. Briefly, GAS tissues were minced and treated with 0.3 mg/mL Nagarse (Sigma) for 3 min on ice, followed by centrifugation at 700 × g for 10 min, repeated twice to remove debris. Mitochondria were pelleted by centrifugation at 8000 × g for 10 min. Isolated mitochondria (30 μg) were incubated with Amplex Red reagent and HRP solution at room temperature, and fluorescence was measured using a Spark 10 M microplate reader (Tecan).
Quantitative Reverse Transcriptase Polymerase Chain Reaction
Total RNA was extracted using the QIAzol Lysis Reagent (Qiagen) and the AccuPrep Universal RNA Extraction Kit (Bioneer). cDNA was synthesized using the PrimeScript RT Reagent Kit (Takara) according to the manufacturer's guidelines. Quantitative reverse transcriptase polymerase chain reaction (qRT‐PCR) was performed using the TB Green Premix Ex Taq II (Takara) on a QuantStudio 3 Real‐Time PCR system (Applied Biosystems). Relative gene expression was determined using the 2(−∆∆Ct) method, normalized to 18S rRNA. For the evaluation of mitochondrial DNA (mtDNA) content, qRT‐PCR was performed on purified DNA using primers for Cytb and Rplp0 (36B4). A complete list of primers used in this study is provided in Table S2.
Statistical Analysis
All values were presented as mean ± standard error of the mean (SEM). Statistical analysis for comparisons involving more than 2 groups was performed using one‐way ANOVA followed by Tukey's post hoc test, while comparisons between 2 groups were analysed using Student's t test. A p value of less than 0.05 was considered statistically significant. All statistical analyses were conducted using the SPSS Statistics 26 (IBM) software.
Results
andExhibit Distinct Expression Patterns Compared to OtherGenes During Myogenesis and Muscle Regeneration Prdx3 Prdx5 Prdx
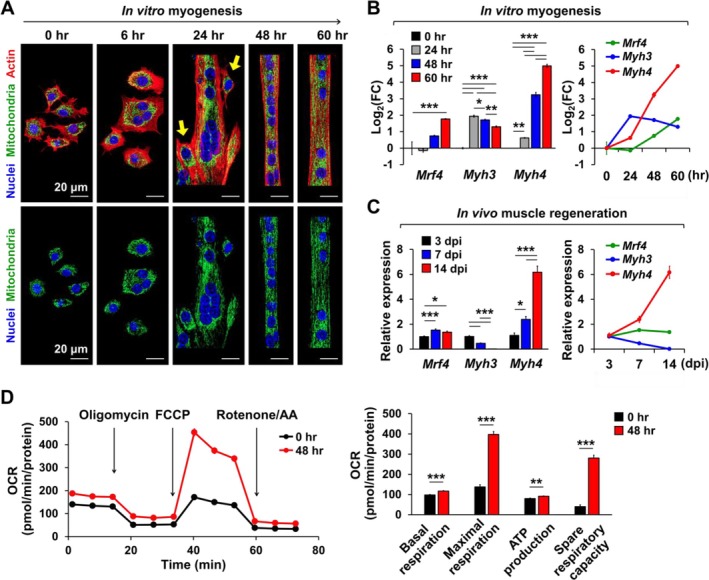
To analyse nuclear and mitochondrial positioning during myotube differentiation, we isolated primary myoblasts from mitochondrial reporter (mt‐GFP) mice, which express green fluorescent protein (GFP) in the mitochondrial matrix, and induced differentiation into myotubes. Myoblast fusion was observed as early as 6 h into differentiation, with notable nuclear centration occurring by 24 h (Figure 1A). By 48 h, elongated myotubes with evenly distributed nuclei and mitochondria were observed (Figure 1A and Movie 1). At 24 h, when nuclei and mitochondria began to actively disperse along the myotube, the expression of Mrf4 and Myh4, mid‐ to late‐stage myogenic markers, sharply increased, whereas the expression of Myh3, an early myogenic marker, decreased (Figure 1B). A similar expression pattern of myogenic markers was detected in regenerating muscle in vivo following snake venom‐induced injury to the TA muscle (Figure 1C). Mitochondrial OCR significantly increased during myogenesis, as indicated by elevated basal and maximal respiration, ATP production, and spare respiratory capacity at 48 h compared to 0 h of myogenic induction (Figure 1D).
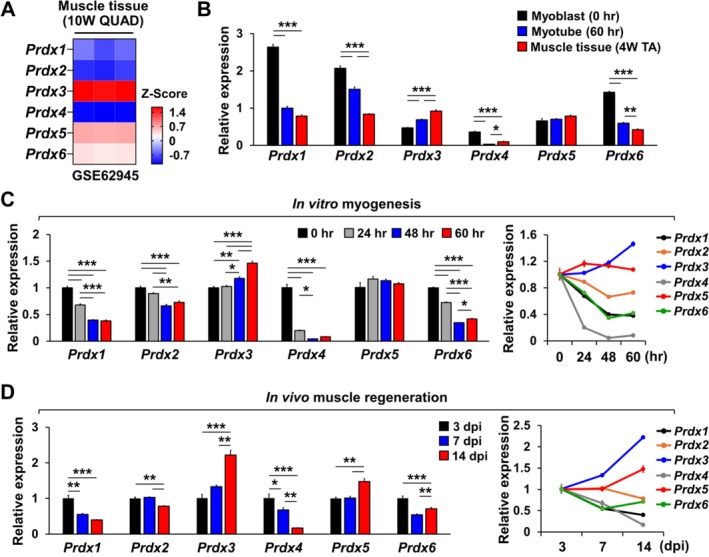
Next, we examined the expression patterns of Prdx genes in skeletal muscle tissue and in vitro myotubes. In the quadriceps muscle of 10‐week‐old mice, Prdx3 and Prdx5 were the two most abundantly expressed Prdx isoforms (Figure 2A). Furthermore, a comparison of Prdx gene expression levels in myoblasts, in vitro myotubes and TA muscle revealed that only Prdx3 and Prdx5 showed an increasing (Prdx3) or a stable (Prdx5) expression pattern as myoblasts differentiated into myotubes and matured into muscle tissue, whereas the expression of other Prdx genes significantly decreased (Figure 2B). A similar trend was observed during in vitro myogenesis, where only Prdx3 and Prdx5 displayed increasing or stable expression levels (Figure 2C). Among all Prdx genes, Prdx3 and Prdx5 were also the only ones to show increased expression during in vivo muscle regeneration induced by snake venom (Figure 2D). These findings suggest that Prdx3 and Prdx5 may have distinct and functionally significant roles in myogenesis and muscle regeneration.

Comparison of myogenic marker expression patterns during in vitro myogenesis and in vivo muscle regeneration. (A) Representative confocal images illustrating the differentiation of primary myoblasts into myotubes. Arrows on 24 h of differentiation (24 h) highlight fusing myoblasts. From 24 to 60 h, nuclei and mitochondria are longitudinally distributed along the myotubes. Scale bars are displayed with actual size values. (B, C) qRT‐PCR analysis of myogenic markers during in vitro myogenesis (B, = 3) and in vivo muscle regeneration induced by snake venom (C, = 5–7). Note the similar expression patterns of myogenic markers between in vitro myogenesis and in vivo muscle regeneration. Dpi, days after injury. (D) OCR analysis during in vitro myogenesis ( = 8). Note that mitochondrial function parameters such as basal and maximal respiration, ATP production and spare respiratory capacity are elevated in mature myotubes. All data represent mean ± SEM. Statistical significance is indicated as * < 0.05, ** < 0.01 and *** < 0.001, analysed by ANOVA with Tukey's post hoc test (B, C), or bytest (D). OCR, oxygen consumption rate; qRT‐PCR, quantitative reverse transcriptase polymerase chain reaction. n n n p p p t

andexhibit distinct expression patterns in developing myotubes and regenerating skeletal muscle compared to othergenes. (A) Comparison ofgene expression levels in quadriceps muscles of 10‐week‐old mice (GSE62945). Note thatandare among the most highly expressedgenes in muscle tissue. (B) qRT‐PCR analysis ofexpression levels in cultured myoblasts, cultured myotubes and tibialis anterior (TA) muscle tissues of 4‐week‐old mice ( = 3). Expression levels are shown relative to thelevel in myotubes. Among thegenes, onlyandexhibit greater or comparable expression levels in myotubes and muscle tissues compared to myoblasts. (C, D) qRT‐PCR analysis ofexpression patterns during in vitro myogenesis (C, = 3) and in vivo muscle regeneration induced by snake venom (D, = 3). Notably,andshow an increasing expression pattern during muscle regeneration, whereas othergenes exhibit a decreasing expression pattern. All data represent mean ± SEM. Statistical significance is indicated as * < 0.05, ** < 0.01 and *** < 0.001, analysed by ANOVA with Tukey's post hoc test., peroxiredoxin; qRT‐PCR, quantitative reverse transcriptase polymerase chain reaction; QUAD, quadriceps. Prdx3 Prdx5 Prdx Prdx Prdx3 Prdx5 Prdx Prdx n Prdx1 Prdx Prdx3 Prdx5 Prdx n n Prdx3 Prdx5 Prdx p p p Prdx
PRDX5 Deficiency Impairs Myonuclear Distribution
To investigate the role of PRDX3 and PRDX5 in myogenesis, we isolated myoblasts from wild‐type mt‐GFP (WT; mt‐GFP), Prdx3−/−; mt‐GFP, Prdx5−/−; mt‐GFP and Prdx3−/−; Prdx5−/−; mt‐GFP mice and induced differentiation into myotubes. After 48 h of differentiation, Prdx5−/−; mt‐GFP and Prdx3−/−; Prdx5−/−; mt‐GFP myotubes exhibited impaired nuclear and mitochondrial distribution, leading to aggregated nuclei and mitochondria, while WT; mt‐GFP and Prdx3−/−; mt‐GFP myotubes displayed an even distribution of nuclei and mitochondria (Figure 3A, Movies 2, 3). Quantification of myotubes containing clustered nuclei revealed that Prdx5−/− myotubes exhibited more than twice the percentage of clustered nuclei compared to WT myotubes (Figure 3B). Notably, nuclear clustering was not further increased in Prdx3−/− or Prdx3−/−; Prdx5−/− myotubes compared to WT and Prdx5−/− myotubes, respectively, indicating that the impaired nuclear distribution is specifically caused by Prdx5 deficiency rather than Prdx3 deficiency (Figure 3B). Next, we investigated whether myonuclear distribution is impaired in mature myofibers of Prdx5−/− mice in vivo (Figure 3C). Myofibers were isolated from EDL muscles of 48‐week‐old mice and stained for neuromuscular junctions (NMJs) and satellite cells. Since myonuclei are naturally clustered in NMJs [31], we avoided these regions for analysis. Additionally, we separately labelled satellite cells using a PAX7 antibody to effectively distinguish them from myonuclei. Analysis of myofibers revealed a dramatic, 4‐fold increase in the percentage of myofibers with clustered myonuclei in Prdx5−/− myofibers (Figure 3D), indicating that Prdx5 deficiency disrupts myonuclear distribution both during in vitro myogenesis and in mature myofibers in vivo.
Because PRDXs are well‐known H2O2 scavengers and have been reported to prevent ROS accumulation [2, 32], we treated developing myotubes with H2O2 to assess its effect on nuclear clustering. Treatment with 0.5 mM H2O2 at 24 h of myogenesis significantly increased nuclear clustering in WT myotubes at 48 h, reaching a level comparable to that observed in Prdx5−/− myotubes (Figure 3E, F). However, H2O2 treatment further exacerbated nuclear clustering in Prdx5−/− myotubes (Figure 3E, F), suggesting that although H2O2 accumulation may contribute to the myonuclear clustering phenotype in Prdx5−/− myotubes, it is not the sole cause.

PRDX5 deficiency impairs nuclear and mitochondrial distribution during myogenesis. (A) Representative confocal images of wild‐type mitochondrial reporter mice expressing GFP in the mitochondrial matrix (WT; mt‐GFP),; mt‐GFP,; mt‐GFP and;; mt‐GFP myotubes at 48 h. Arrows indicate abnormal myotubes with clustered nuclei or mitochondria. Mitochondrial GFP intensity profiles along the yellow and purple dashed lines highlight mitochondrial distribution patterns within individual myotubes. Note the uneven mitochondrial distribution in; mt‐GFP and;; mt‐GFP myotubes. (B) Quantitative analysis of clustered nuclei in myotubes at 48 h. The percentage of myotubes containing more than 5 clustered nuclei was measured ( = 3 independent wells; 106–114 myotubes). The absence ofdid not further increase myonuclear clustering inmyotubes. (C, D) Representative fluorescence images (C) and quantitative analysis (D) of WT andmyofibers isolated from EDL muscles of 48‐week‐old mice. In (C), arrowheads and arrows indicate PAX7‐positive satellite cells and clustered myonuclei outside of NMJ regions, respectively. Myofibers were classified as having clustered myonuclei in (D) if they contained at least three adjacently located myonuclei. A total of 105 and 110 myofibers were analysed for WT andgroups, respectively, with myofibers pooled from three mice per group. BTX, bungarotoxin. (E, F) Representative confocal images (E) and quantitative analysis (F) of WT; mt‐GFP and; mt‐GFP myotubes treated with distilled water (dw) or 0.5 mM HO, 24 h after myogenic induction ( = 3 independent wells; 94–102 myotubes). In (E), arrows highlight clustered nuclei. The percentage of myotubes containing more than five clustered nuclei was measured in (F). All scale bars are displayed with actual size values. Data (B) and (F) represent mean ± SEM. Statistical significance is indicated as ** < 0.01 and *** < 0.001, analysed by ANOVA with Tukey's post hoc test. EDL, extensor digitorum longus; NMJ, neuromuscular junction. Prdx3 Prdx5 Prdx3 Prdx5 Prdx5 Prdx3 Prdx5 n Prdx3 Prdx5 Prdx5 Prdx5 Prdx5 n p p −/− −/− −/− −/− −/− −/− −/− −/− −/− −/− −/− 2 2
PRDX5 Deficiency Leads to Mitochondrial Dysfunction in Skeletal Muscle
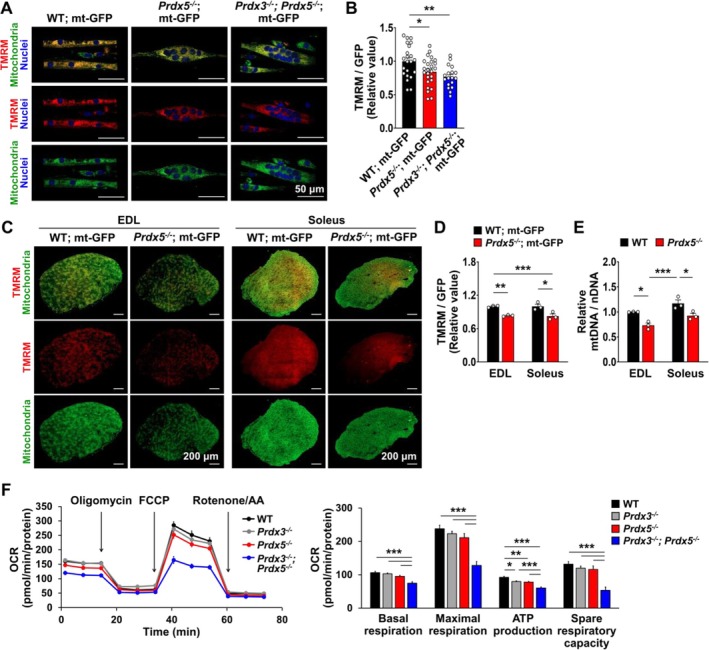
We next examined whether Prdx5 deficiency affects mitochondrial function in myotubes and muscle tissue. To assess mitochondrial function, we used TMRM dye to measure mitochondrial membrane potential. At 48 h of differentiation, mitochondrial membrane potential, indicated by TMRM fluorescence intensity normalized to endogenous mitochondrial GFP intensity, was significantly reduced in Prdx5−/−; mt‐GFP and Prdx3−/−; Prdx5−/−; mt‐GFP myotubes compared to WT; mt‐GFP myotubes (Figure 4A, B). Furthermore, mitochondrial membrane potential was significantly lower in both EDL and soleus muscle cross‐sections of 48‐week‐old Prdx5−/−; mt‐GFP mice compared to WT; mt‐GFP mice (Figure 4C, D). Notably, endogenous mitochondrial GFP signal appeared reduced in muscle cross‐sections of Prdx5−/−; mt‐GFP mice, implying a decrease in mitochondrial content (Figure 4D). Consistently, quantification of the mitochondrial DNA‐to‐nuclear DNA ratio revealed a reduction in mitochondrial quantity in both the EDL and soleus muscles of Prdx5−/− mice compared to WT mice (Figure 4E). We also measured mitochondrial OCR in differentiated myotubes, which revealed a significant reduction in ATP production in Prdx3−/− and Prdx5−/− myotubes (Figure 4F). Basal respiration, maximal respiration, ATP production and spare respiratory capacity were further reduced in Prdx3−/−; Prdx5−/− myotubes, indicating an additive effect of dual deficiency on mitochondrial function (Figure 4F). Additionally, staining myotubes with ATP‐Red dye, which specifically labels mitochondrial ATP, confirmed that mitochondrial ATP production was diminished in Prdx5‐deficient myotubes (Movie 4). Mitochondrial morphology was also abnormal in Prdx5−/− and Prdx3−/−; Prdx5−/− myotubes, exhibiting a fragmented appearance (Movie 4). The expression of mitochondrial fusion markers, particularly Mfn2, showed a decreasing trend in Prdx5‐deficient myotubes, while mitochondrial fission markers remained unchanged (Figure S1).
To investigate whether mitochondrial dysfunction induces nuclear clustering in myotubes, we treated developing myotubes with Oligomycin A, an ATP synthase inhibitor. Treatment with 0.1 μM oligomycin A at 24 h of differentiation dramatically increased nuclear clustering by 48 h (Figure S2), suggesting that mitochondrial ATP production is essential for proper nuclear distribution and that mitochondrial dysfunction partially contributes to impaired nuclear spreading in Prdx5‐deficient myotubes.

Absence of PRDX5 leads to mitochondrial dysfunction in skeletal muscle. (A, B) Representative confocal images (A) and quantitative analysis (B) of WT; mt‐GFP,; mt‐GFP and;; mt‐GFP myotubes stained with TMRM (tetramethylrhodamine methyl ester, a mitochondrial membrane potential indicator) at 48 h ( = 18–25 myotubes from 3 independent wells). (C, D) Representative confocal images (C) and quantitative analysis (D) of TMRM‐stained muscle cross‐sections of 48‐week‐old WT; mt‐GFP and; mt‐GFP mice ( = 3). Note the diminished mitochondrial membrane potential in both the EDL and soleus muscles ofmice.( E) qRT‐PCR analysis of the relative ratio of mtDNA to nDNA in EDL and soleus muscle tissues of 48‐week‐old mice ( = 3).(F) OCR analysis in myotubes at 72 h ( = 9). Note that mitochondrial ATP production is significantly decreased in,and;myotubes compared to WT myotubes. All scale bars are displayed with actual size values. All data represent mean ± SEM Statistical significance is indicated as * < 0.05, ** < 0.01 and *** < 0.001, analysed by ANOVA with Tukey's post hoc test. mtDNA, mitochondrial DNA; nDNA, nuclear DNA. Prdx5 Prdx3 Prdx5 n Prdx5 n Prdx5 n n Prdx3 Prdx5 Prdx3 Prdx5 p p p −/− −/− −/− −/− −/− −/− −/− −/− −/−
PRDX5 Induces Miro1 and Milton Expression to Promote Mitochondrial Transport During Myogenesis
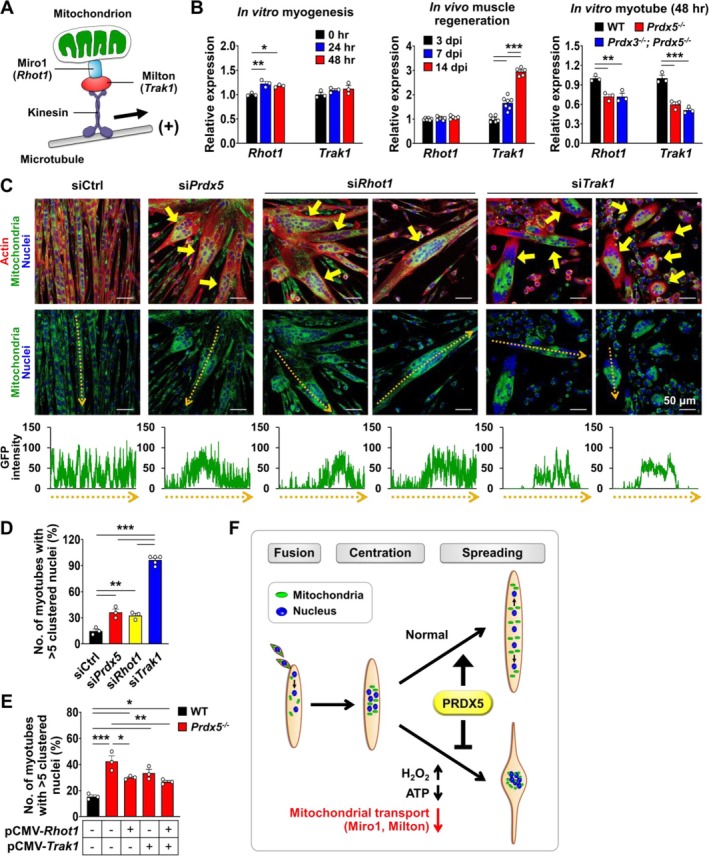
Inside the cell, mitochondria are actively transported along microtubules by kinesin and dynein motor proteins [11]. In particular, kinesin motor proteins mediate the anterograde transport of mitochondria towards microtubule plus ends, a key process in mitochondrial distribution along myotubes. Mitochondria are linked to kinesin motor proteins via Miro1, a mitochondrial outer membrane protein, and Milton, an adaptor protein that connects kinesin to Miro1 (Figure 5A). During in vitro myotube differentiation, the expression of Rhot1, which encodes Miro1, significantly increased at 24 and 48 h compared to 0 h (Figure 5B). Similarly, the expression of Trak1, which encodes Milton, exhibited an increasing trend during in vitro myotube formation and was significantly elevated in regenerating muscle tissue in vivo at 7 and 14 days after injury (dpi) (Figure 5B). Notably, the expression of both Rhot1 and Trak1 was significantly downregulated in Prdx5−/− and Prdx3−/−; Prdx5−/− myotubes at 48 h (Figure 5B). However, Rhot1 and Trak1 expression levels were not further reduced in Prdx3−/−; Prdx5−/− myotubes compared to Prdx5−/− myotubes, suggesting that PRDX5 specifically regulates their expression levels. Furthermore, treatment with H2O2 did not decrease Rhot1 or Trak1 expression in myotubes, indicating that their downregulation in Prdx5‐deficient myotubes is unlikely to be an indirect effect of elevated H2O2 levels (Figure S3A). The expression of Kif5b, which encodes a kinesin subunit, was mildly downregulated in Prdx5−/− myotubes (Figure S3B).
To determine whether mitochondrial transport plays a significant role in nuclear distribution during myotube formation, we performed siRNA‐mediated knockdown of Prdx5, Rhot1 or Trak1 in WT; mt‐GFP myoblasts simultaneously with myogenic induction (Figure 5C). After confirming successful gene knockdown (Figure S3C) and impaired mitochondrial distribution and transport along microtubules (Figure 5C and Movie 5), we assessed nuclear distribution in myotubes at 48 h, which revealed a significant increase in nuclear clustering upon Prdx5, Rhot1 or Trak1 downregulation (Figure 5D). Trak1 knockdown led to the most dramatic increase in myonuclear clustering, with approximately 90% of myotubes exhibiting clustered nuclei, while Rhot1 knockdown resulted in a similar level of nuclear clustering as Prdx5 knockdown (Figure 5D). Prdx5, Rhot1 or Trak1 knockdown also significantly reduced the expression of Mrf4, a myogenic maturation marker, with the most pronounced reduction observed upon Trak1 knockdown (Figure S3D). Conversely, overexpression of Rhot1 alone or in combination with Trak1 significantly attenuated nuclear clustering in Prdx5−/− myotubes, indicating that restoring mitochondrial transport promotes proper nuclear distribution (Figure 5E and Figure S3E). Collectively, these findings suggest that mitochondrial transport via Miro1 and Milton is essential for normal myotube development and nuclear spreading and that PRDX5 facilitates this process by promoting the expression of Rhot1 and Trak1 (Figure 5F).

PRDX5 regulates Miro1 and Milton expression to promote mitochondrial transport, facilitating nuclear distribution during myotube formation. (A) Diagram illustrating key proteins involved in mitochondrial transport. Miro1, a mitochondrial outer membrane protein encoded bygene, interacts with Milton, an adaptor protein encoded bygene, to anchor mitochondria to the motor protein kinesin. (B) qRT‐PCR analysis of mitochondrial transport regulators (and) during in vitro myogenesis ( = 3) and venom‐induced in vivo muscle regeneration ( = 5–7), as well as in WT,and;myotubes cultured for 48 h ( = 3). (C) Representative confocal images of siRNA‐treated myotubes at 48 h. Arrows indicate abnormal myotubes with clustered nuclei or mitochondria. Mitochondrial GFP intensity profiles along the yellow dashed lines highlight mitochondrial distribution patterns within individual myotubes. Scale bars are displayed with actual size values.(D) Quantitative analysis of clustered nuclei in siRNA‐treated myotubes at 48 h ( = 3–5 independent wells; 95–110 myotubes). The percentage of myotubes containing more than 5 clustered nuclei was measured. (E) Quantitative analysis of clustered nuclei inmyotubes at 48 h following overexpression of,, or both ( = 3 independent wells; 92–99 myotubes). The percentage of myotubes containing more than 5 clustered nuclei was measured. The pCMV empty vector was used as a control. (F) Summary diagram illustrating how PRDX5 regulates nuclear spreading during myotube formation. PRDX5 induces Miro1 and Milton expression to promote mitochondrial transport, which is essential for proper nuclear distribution. All data represent mean ± SEM Statistical significance is indicated as * < 0.05, ** < 0.01 and *** < 0.001, analysed by ANOVA with Tukey's post hoc test. Rhot1 Trak1 Rhot1 Trak1 n n Prdx5 Prdx3 Prdx5 n n Prdx5 Rhot1 Trak1 n p p p −/− −/− −/− −/−
Absence of PRDX5 Leads to Impaired Muscle Regeneration and Mitochondrial Transport In Vivo
To investigate the impact of PRDX5 deficiency on muscle regeneration in vivo, we injected the GAS and TA muscles of WT or Prdx5−/− mice with snake venom and analysed muscle tissues at 3, 7, 14 and 28 dpi (Figure 6A). Analysis of muscle regeneration marker expression revealed impaired muscle regeneration in Prdx5−/− mice, with significantly decreased Mrf4 and Myh3 expression at 3 dpi and reduced Myh4 expression at 7 and 14 dpi (Figure 6B). The delayed maturation of regenerating myofibers in Prdx5−/− muscles was further evidenced by a delayed reduction in Myh3, which encodes embryonic myosin heavy chain (eMHC), at 7 dpi (Figure 6B). Consistent with the gene expression data, histological analysis at 3 and 7 dpi demonstrated impaired muscle regeneration, as indicated by the defective formation of healthy, centrally nucleated regenerating myofibers (Figure 6C, D and Figure S4A, B). Notably, Prdx5−/− mice exhibited regenerating myofibers with aggregated nuclei, similar to what was observed during in vitro myogenesis (Figure 6D). At 28 dpi, histology further revealed persistent defects in regeneration in Prdx5−/− muscles, characterized by persistent regions of fibrosis and calcification (Figure S4C). To further examine regenerating myofibers in three dimensions, we performed whole‐mount staining of venom‐injured EDL muscles (Figure S4D). Unlike in WT mice, regenerating myofibers (eMHC‐positive) in Prdx5−/− mice exhibited disrupted nuclear distribution and abnormal mitochondrial morphology, characterized by a fragmented or swollen appearance (Figure 6E). Gene expression analysis revealed that Rhot1 and Trak1 expression levels were significantly decreased in regenerating muscle tissues of Prdx5−/− mice at 3, 7 and 28 dpi, indicating impaired mitochondrial transport (Figure 6F). These findings demonstrate that PRDX5 promotes muscle regeneration in vivo by facilitating proper mitochondrial transport and nuclear distribution.

(A) Muscle regeneration analysis scheme. Snake venom was locally injected into the GAS and TA muscles of 4‐week‐old mice. (B) qRT‐PCR analysis of muscle regeneration markers in the TA muscles of WT andmice at 0, 3, 7, 14 and 28 dpi ( = 3–7).(C, D) Representative H&E images (C) and fluorescence images (D) of cross‐sections of GAS muscles from WT andmice at 7 dpi ( = 4–7). Magnified images of the boxed regions, shown in the lower panels, display regenerating myofibers characterized by centrally located nuclei or positive staining for eMHC. Note the impaired muscle regeneration inmice. Arrows in (D) highlight regenerating myofibers with aggregated nuclei inmice. (E) Representative confocal images of whole‐mount EDL muscles of WT; mt‐GFP and; mt‐GFP mice at 5 dpi. Regenerating myofibers were labelled with anti–eMHC antibody. Arrows highlight abnormal mitochondrial morphology (swollen or fragmented) and alignment inmyofibers. (F) qRT‐PCR analysis of mitochondrial transport regulators in the TA muscles of WT andmice at 0, 3, 7, 14 and 28 dpi ( = 3–7). All scale bars are displayed with actual size values. All data represent mean ± SEM Statistical significance is indicated as * < 0.05, ** < 0.01 and *** < 0.001, analysed bytest. eMHC, embryonic myosin heavy chain; GAS, gastrocnemius; H&E, haematoxylin and eosin; TA, tibialis anterior. PRDX5 deficiency impairs muscle regeneration and mitochondrial transport following muscle injury. Prdx5 n Prdx5 n Prdx5 Prdx5 Prdx5 Prdx5 Prdx5 n p p p t −/− −/− −/− −/− −/− −/− −/−
Combined Deficiency of PRDX3 and PRDX5 Accelerates Muscle Aging Characteristics
We next focused on the analysis of Prdx3−/−; Prdx5−/− mice and found that, unlike Prdx5−/− mice, they exhibited significant reductions in muscle mass throughout the body as early as 10 weeks of age (Figure 7A). This muscle mass loss was accompanied by an increase in Fbxo32 and Trim63 expression, which encode the muscle‐specific E3 ubiquitin ligases Atrogin1 and MURF1, respectively, in the soleus and EDL muscles of Prdx3−/−; Prdx5−/− mice at 10 weeks of age (Figure 7A). In addition to reduced muscle mass, grip strength and treadmill running performance were significantly decreased in Prdx3−/−; Prdx5−/− mice compared to WT or Prdx5−/− mice at 9–11 weeks of age (Figure 7A). The muscle atrophy and functional reduction observed in Prdx3−/−; Prdx5−/− mice at a young age reflect a sarcopenic phenotype, suggesting that the combined deficiency of PRDX3 and PRDX5 accelerates muscle aging. While Prdx5−/− mice did not exhibit muscle mass or strength loss at a young age, their running performance was significantly impaired at 47–50 weeks of age, reflecting mitochondrial dysfunction in muscle (Figure 7A). Fat mass was also significantly increased in Prdx5−/− mice at 47–50 weeks of age (Figure S5).
To examine whether excessive H2O2 accumulation drives the muscle aging phenotype observed in Prdx3−/−; Prdx5−/− mice, we isolated live mitochondria from muscle tissues and performed Amplex Red assay to measure H2O2 production levels (Figure 7B). Compared to mitochondria from WT muscle, those from Prdx3−/−; Prdx5−/− muscle showed a significant increase in H2O2 production (Figure 7C). Furthermore, H2O2 treatment of myotubes significantly upregulated the expression of muscle proteolysis markers Fbxo32 and Trim63 (Figure 7D), demonstrating that excessive H2O2 accumulation contributes to the muscle aging phenotype in Prdx3−/−; Prdx5−/− mice. To investigate additional mechanisms driving Atrogin1 and MURF1 expression beyond elevated oxidative stress, we evaluated the expression of Ppargc1a (PGC‐1α), a known suppressor of Atrogin1 and MURF1 transcription [33] (Figure S6A). Ppargc1a expression was significantly reduced in Prdx3−/−; Prdx5−/− muscles, supporting the possibility that its downregulation contributes to the elevated expression of muscle proteolysis genes in the double knockout muscles. However, Ppargc1a expression was also significantly decreased in the soleus of Prdx5−/− mice at 10 weeks of age, despite no significant increase in Atrogin1 or MuRF1 levels (Figure 7A and Figure S6A). This suggests that a threshold level of PGC‐1α may exist, below which the induction of these proteolytic genes is triggered.
Next, we analysed publicly available datasets to assess changes in Prdx gene expression during aging and under pathological muscle conditions. Among the Prdx genes, Prdx3 and Prdx5 were the two most dramatically downregulated genes in aged mouse soleus and aged rat GAS (Figure 7E). Notably, Prdx3 and Prdx5 were the only downregulated Prdx genes in aged rat GAS, whereas all other Prdx genes were upregulated at 22 and 24 months of age compared to 8 months of age (Figure 7E), highlighting a strong association between muscle aging and reduced PRDX3 and PRDX5 levels in rodent muscles. Prdx3 and Prdx5 levels also showed a decreasing trend in mouse models of Duchenne muscular dystrophy (DMD) and dysferlinopathy‐associated accelerated muscle degeneration (Figure S6B). Trak1 expression was also significantly reduced in aged mouse soleus and GAS, mirroring the expression pattern of Prdx5 (Figure S6C). In human vastus lateralis muscle, PRDX2 and PRDX5 expression levels were significantly decreased in sarcopenic individuals compared to young or age‐matched healthy individuals. Among them, PRDX5 showed the most significant decrease, highlighting its potential importance in human muscle aging (Figure 7E). Collectively, these findings suggest that PRDX3 and PRDX5 work together to prevent excessive H2O2 accumulation, thereby mitigating muscle proteolysis, muscle atrophy and strength loss, and ultimately preserving both muscle quantity and quality, and that their loss may lead to accelerated muscle aging (Figure 7F).

Combined deficiency of PRDX3 and PRDX5 leads to premature muscle aging, characterized by decreased muscle mass and strength, along with increased muscle proteolysis. (A) The leftmost graph in the top row shows muscle weight analysis of 10‐week‐old WT,and;mice ( = 4–14). The percent increase in muscle weight is presented relative to WT values. PEC, pectoralis; TRI, triceps; QUAD, quadriceps; GAS, gastrocnemius. The two graphs to the right display qRT‐PCR analysis of muscle proteolysis markersandin the soleus and EDL muscle tissues of 10‐week‐old WT,and;mice ( = 3). The leftmost graph in the bottom row presents maximal grip strength (grams, g) analysis of 10‐week‐old WT,and;mice ( = 4–9). The remaining graphs show treadmill running performance of 9–11‐week‐old WT,and;mice ( = 3–6), as well as 47–50‐week‐old WT andmice ( = 10). Running time was measured in seconds (s), running distance in meters (m) and work in joules (j). (B, C) Schematic (B) and quantitative analysis (C) of mitochondrial HOgeneration using the Amplex Red assay, performed on live mitochondria isolated from GAS muscle tissues of 9–10‐week‐old mice ( = 3). Note that the magnitude and rate of HOproduction are higher in;mitochondria than WT mitochondria. (D) qRT‐PCR analysis of muscle proteolysis markers in 48 h myotubes treated with dw (distilled water) or 0.5 mM HO, 24 h after myogenic induction ( = 3).(E) Gene expression analysis of/members in skeletal muscle tissues from mice, rats and humans using publicly available transcriptomic datasets. Heatmaps on the left show relativeexpression in the soleus muscles of 10‐ and 30‐month‐old mice (GSE139204; SarcoAtlas) and the GAS muscles of rats aged 18–24 months compared to 8 months (GSE78702; SarcoAtlas). Red arrowheads indicate marked reductions inandexpression with aging. Graphs on the right displayexpression levels in human vastus lateralis muscles from young and older sarcopenic individuals (GSE167186) and from old healthy versus old sarcopenic individuals (GSE111016). Among thegenes, PRDX5 shows the most significant downregulation in sarcopenic human muscle, with the lowestvalue. TPM, transcripts per million.(F) Summary diagram illustrating that PRDX3 and PRDX5 together prevent excessive HOaccumulation, thereby mitigating HO‐induced muscle proteolysis and reducing the risk of muscle atrophy and strength loss. All data represent mean ± SEM Statistical significance is indicated as * < 0.05, ** < 0.01 and *** < 0.001, analysed by ANOVA with Tukey's post hoc test (A), or bytest (A, C, D). For (E), statistical significance was assessed using the Wald test with Benjamini–Hochberg correction in DESeq2. Prdx5 Prdx3 Prdx5 n Fbxo32 Trim63 Prdx5 Prdx3 Prdx5 n Prdx5 Prdx3 Prdx5 n Prdx5 Prdx3 Prdx5 n Prdx5 n n Prdx3 Prdx5 n Prdx PRDX Prdx Prdx3 Prdx5 PRDX PRDX p p p p t −/− −/− −/− −/− −/− −/− −/− −/− −/− −/− −/− −/− −/− −/− −/− 2 2 2 2 2 2 2 2 2 2
Discussion
In this study, we identified a previously unrecognized role of PRDX5 in skeletal muscle, which involves maintaining mitochondrial function and ensuring proper nuclear distribution during myogenesis and muscle regeneration. Using Prdx3−/−, Prdx5−/− and Prdx3−/−; Prdx5−/− mice, we demonstrated that PRDX5 deficiency, but not PRDX3 deficiency, disrupts myonuclear spreading during myotube formation, indicating that PRDX5 is the primary regulator of nuclear distribution. Mechanistically, we found that PRDX5 supports mitochondrial ATP production and induces the expression of mitochondrial transport regulator genes Rhot1 (encoding Miro1) and Trak1 (encoding Milton), both of which are essential for effective mitochondrial transport and proper myonuclear spreading during muscle development and regeneration. Moreover, we observed that Prdx3−/−; Prdx5−/− mice exhibited an accelerated muscle aging phenotype, characterized by significantly reduced muscle mass and strength as well as increased muscle protein degradation as early as 10 weeks of age. This phenotype was associated with elevated oxidative stress, as muscle mitochondria from Prdx3−/−; Prdx5−/− mice produced significantly higher levels of H2O2 compared to those from WT mice. This increased oxidative stress upregulated muscle‐specific E3 ligases, Atrogin1 and MuRF1, which are known to promote muscle atrophy, suggesting that PRDX3 and PRDX5 function cooperatively to preserve muscle mass.
One of the most significant findings of our study is that PRDX5 regulates myonuclear distribution by promoting the expression of Rhot1 and Trak1. siRNA‐mediated downregulation of these genes impaired mitochondrial transport and led to increased nuclear clustering in myotubes, highlighting that proper mitochondrial transport, facilitated by PRDX5, is essential for myonuclear spreading. However, the mechanism by which PRDX5 regulates the transcription of these genes remains to be elucidated. While PRDXs are well‐known for their antioxidant functions, they also perform antioxidant‐independent activities such as directly modulating transcription factors. For instance, a previous study demonstrated that PRDX5 can directly interact with heterogeneous nuclear ribonucleoprotein K (hnRNPK) in the nucleus to regulate gene expression in osteoblasts [22]. Interestingly, dysregulated hnRNPK activity has been reported to cause the formation of abnormal myotubes with locally spherical morphology [34], which is similar to the phenotype observed in many PRDX5‐deficient myotubes, implying that hnRNPK may play a significant role in the actions of PRDX5 during myotube formation. PRDX5 has also been reported to directly bind to nuclear factor erythroid 2‐related factor 2 (NRF2), a key transcription factor that binds to antioxidant response element (ARE) sites to enhance the expression of various cytoprotective genes [21]. These findings suggest that PRDX5 may regulate the expression of Rhot1 and Trak1 through similar mechanisms, possibly by directly modulating the activity of transcription factors specific to Rhot1 and Trak1. Notably, we performed transcription factor binding site analysis using publicly available databases, such as Tfsitescan and GeneHancer [35, 36], and identified specificity protein 1 (SP1) as one of the top transcription factors for both Rhot1 and Trak1. SP1 has been shown to form a complex with NRF2 [37], suggesting that PRDX5 may potentially regulate Rhot1 and Trak1 expression by modulating SP1. However, transcription factors for Rhot1 and Trak1 have not been directly tested in experiments to date, and future studies will investigate whether PRDX5 modulates transcription factor activities to promote Rhot1 and Trak1 expression. Further investigation is also needed to clarify the mechanistic link between mitochondrial distribution and nuclear spreading. One plausible explanation is that proper mitochondrial positioning ensures localized ATP supply, which is crucial for kinesin‐mediated nuclear movement that requires ATP [38].
Both mitochondria and nuclei are transported along the microtubule cytoskeleton during myogenesis [17, 39]. In our analysis, a subset of PRDX5‐deficient myotubes displayed disrupted microtubule networks (Movie 3 and Movie 5), suggesting that defective microtubule structures may contribute to the impaired mitochondrial and nuclear distribution observed in these myotubes. However, it remains unclear whether this disruption is a cause or a consequence of impaired myogenesis in PRDX5‐deficient myotubes. Notably, some PRDX5‐deficient myotubes with impaired nuclear spreading did not display significant microtubule defects, complicating the interpretation of these results. Similarly, a previous study reported that microtubule‐associated protein 7 (MAP 7)‐depleted myotubes exhibited disrupted nuclear spreading without noticeable microtubule defects [16], indicating that microtubule integrity alone may not fully explain the observed phenotypes. Further research is needed to determine whether PRDX5 directly influences microtubule stability and organization during myotube formation.
Unlike Prdx3−/−; Prdx5−/− mice, which exhibited significant reductions in muscle mass, PRDX5 deficiency alone did not significantly affect muscle mass, particularly at a young age, suggesting that intracellular H2O2 levels in Prdx5−/− muscles may not have reached the threshold required to induce muscle wasting. It is possible that compensatory actions by other PRDX isoforms, glutathione peroxidases, or catalases that regulate H2O2 levels may have mitigated oxidative stress in the absence of PRDX5. However, prolonged PRDX5 deficiency eventually led to muscle mitochondrial dysfunction, compromising muscle quality and running endurance capacity. Although dysregulated H2O2 levels likely have directly contributed to the muscle defects observed in Prdx5−/− mice, our results suggest that impaired mitochondrial ATP production and transport, along with the resultant defects in myonuclear spreading, may be the major drivers of reduced exercise capacity and impaired muscle regeneration in these mice. Lean mass, as measured by DXA, did not significantly decrease even at 47–50 weeks of age in Prdx5−/− mice, indicating that PRDX5 is more critical for preserving muscle quality rather than muscle quantity. Importantly, the combined deficiency of PRDX3 and PRDX5 led to substantial muscle loss at a young age, highlighting their cooperative roles in preserving muscle mass. The accelerated muscle atrophy observed in Prdx3−/−; Prdx5−/− mice suggests that PRDX3 and PRDX5 work synergistically to prevent excessive oxidative damage and maintain both muscle mass and strength. These findings underscore the importance of antioxidant defences in preventing age‐related muscle degeneration and highlight the potential of augmenting PRDX3 and PRDX5 activity as a therapeutic strategy to combat sarcopenia and muscle aging.
In summary, our study revealed that PRDX5 is a crucial regulator of mitochondrial function and nuclear distribution during myogenesis and muscle regeneration. We demonstrated that PRDX5 promotes proper myonuclear spreading by upregulating Miro1 and Milton, which are critical for effective mitochondrial transport. Additionally, the combined deficiency of PRDX3 and PRDX5 accelerated muscle aging by exacerbating oxidative stress and mitochondrial dysfunction. These findings provide a deeper understanding of the mechanisms by which PRDX5 preserves skeletal muscle integrity and suggest that enhancing the expression or activity of PRDX5 and PRDX3 could serve as a promising therapeutic strategy to counteract sarcopenia and age‐associated muscle degeneration.
Conflicts of Interest
The authors declare no conflicts of interest.