
What this is
- The study investigates the effects of rapalink-1, a bi-steric inhibitor, on fission yeast.
- It reveals that rapalink-1 prolongs chronological lifespan and affects gene expression related to activity.
- The research identifies a metabolic feedback loop involving that regulates activity and lifespan.
Essence
- Rapalink-1 extends chronological lifespan in fission yeast by inhibiting TORC1 and regulating activity. This indicates a complex role of metabolic pathways in lifespan regulation.
Key takeaways
- Rapalink-1 treatment prolongs chronological lifespan in fission yeast, similar to rapamycin, indicating its potential in lifespan extension through TORC1 inhibition.
- , enzymes that convert agmatine to putrescine and urea, are identified as key players in the metabolic feedback loop that regulates activity and lifespan.
- Gene expression analyses reveal that many TORC1-regulated genes lack prior annotations related to ageing, suggesting new avenues for research in lifespan regulation.
Caveats
- The study is limited to fission yeast, and findings may not directly translate to other organisms, including humans.
- Further research is needed to fully elucidate the mechanisms by which influence activity and lifespan.
Definitions
- TOR: A nutrient-sensing signaling pathway that regulates growth and metabolism, impacting lifespan.
- agmatinase: An enzyme that converts agmatine into putrescine and urea, playing a role in arginine metabolism.
Simplified
Introduction
Pharmacological inhibition of the evolutionarily conserved, nutrient-responsive and pro-ageing Target of Rapamycin signalling pathway presents great interest in disease and biogerontology1,2. The centrepieces of the pathway are the TOR PI3 kinase-related kinases that operate within two structurally and functionally distinct protein complexes, TORC1 and TORC2. The complexes are reported to have roles in both spatial and temporal aspects of cellular growth3. While TORC1 is responsible for promoting protein translation, lipid and central carbon metabolism and inhibiting autophagy, TORC2 regulates the cytoskeleton and is required for cell survival3–5. Rapamycin, a macrolide able to inhibit TORC1 in an allosteric manner through interaction with the FKBP12 protein (Fkh1 in fission yeast), is shown to extend lifespan in cellular and animal models1,6–8. Torin1, a dual ATP-competitive inhibitor of TORC1 and TORC2, has also been shown to be beneficial for lifespan in various models, including fission yeast9. Both drugs, together with several rapalogues, are used in numerous clinical trials (www.clinicaltrials.org↗).
Rapalink-1 is a third-generation bi-steric TOR inhibitor that combines rapamycin and sapanisertib (MLN0128)10. Its structure does not disrupt the binding of rapamycin to FKBP12 or the FRB domain of TOR. While MLN0128 has been shown to have poor in vivo efficacy, its link to rapamycin has shown great promise in targeted TORC1 inhibition and cancer regression10,11. Rapalink-1 has been reported to prevent ethanol-induced senescence in endothelial cells12. Nevertheless, its precise effects on chronological lifespan (CLS) have not been addressed, and it is not known whether they will resemble rapamycin or an ATP-competitive inhibitor such as torin1.
Here, we have investigated the effects of rapalink-1 through comparisons with rapamycin using fission yeast, a relevant model in cell biology and ageing studies13–15. Both drugs advance mitosis in fission yeast, albeit with different profiles and kinetics, without halting the cell cycle like the pan-TOR inhibitor torin19 and can prolong CLS. The effects observed on gene expression following rapalink-1 treatment, are consistent with TOR7–9,16 inhibition and new TOR-dependent genes are revealed. Using a combination of classical cell biology and genome-wide cell-based screens, we uncover new TOR-related genes and demonstrate that the enzymes converting agmatine to urea and the polyamine putrescine (agmatinases) are a pivotal pathway that positively impacts lifespan. Microbiota-derived agmatine has been previously reported to prolong host lifespan due to changes in lipid homeostasis. However, here, and for the first time, we reveal that the function of enzymes breaking down agmatine is linked to ageing. Analysis of genetic interactome of agmatinase agm117,18 together with cellular and molecular analyses, uncover a metabolic regulatory feedback loop that impacts on the regulation of TORC1 activity itself. Our data, reveal a more complex image around the agmatinergic function: while agmatine may affect metabolism and lifespan, agmatinases are pivotal in maintaining low TOR activity levels during TORC1-inhibition states, such as starvation or dietary restriction, with clear positive consequences on lifespan. Our data have possible implications to other organisms, including human cells and provide additional novel information on arginine metabolism and the role of polyamines19,20 and polyamine-generating enzymes in ageing.
Results
Rapalink-1 affects cell cycle progression, cell size and TORC1-dependent processes in fission yeast
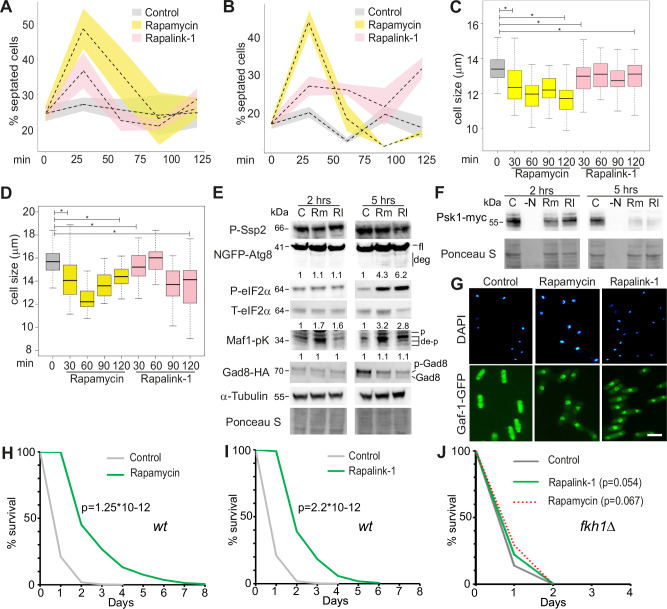
Our septation and cell size results indicate phenotypes related to TORC1 inhibition as previously shown and described7–9,16. We, therefore, investigated whether drug treatments at these concentrations affect multiple aspects of TORC1 functions4. Negative cross-regulation between the AMPK and TORC1 pathways have been previously reported in fission yeast23,24. We, therefore, examined the phosphorylation status of the fission yeast serine/threonine protein kinase AMPK catalytic (alpha) subunit Ssp2. Following two and five hours of treatment with 100 nM of rapamycin or rapalink-1, no observable changes in Ssp2 phosphorylation are found (Fig. 1E). TORC1 negatively regulates autophagy4. Examination of GFP-Atg8 patterns25 following drug treatment in the aforementioned time points, do not show a significant degree of processing25 indicating that effects are not pronounced, at least in these timeframes (Fig. 1E). However, global protein translation might be suppressed five hours post-treatment with both drugs, as seen through increase in phosphorylation of eIF2α while its total levels remain unchanged at both of the 2 h and 5h time points, examined (Fig. 1E, numbers indicate the ratios of total to phospho-eIF2α). We wondered whether drug treatment could affect the activity of Maf1, a Pol III repressor26, through its TORC1-dependent phosphorylation status23. Immunoblotting for Maf1-pK revealed that following treatment with both rapamycin and rapalink-1, Maf1-pK becomes dephosphorylated, more evidently in five hours of treatment (Fig. 1E, numbers indicate ratios of second band-a dephosphorylated form to top-phosphorylated form23,24). While the above results indicate effects on TORC1-dependent processes, we examined whether TORC2-dependent effects are evident following rapalink-1 treatments. Towards this, we have examined the phosphorylation status of Gad8, a kinase dependent on TORC28. The ratios of phosphorylated to dephosphorylated Gad8 forms do not change in the treatments and timelines examined (Fig. 1E, numbers indicate the ratio of phosphorylated-top and dephosphorylated-bottom forms). To confirm effects of rapalink-1 on protein translation (Fig. 1E) we have analysed the levels of Psk1-myc (Psk1 is an S6 kinase27) following nitrogen starvation as well rapamycin and rapalink-1 treatments for two and five hours. In nitrogen starvation global translation and Psk1-myc drop drastically (Fig. 1F). Rapamycin (Rm) and rapalink-1 (Rl) treatments result in reduced amounts of Psk1-myc with the total protein content remaining in comparable levels with those of the control (Fig. 1F). This result strengthens the data, supporting that global protein translation is affected in rapalink-1 treatments as previously seen with rapamycin in fission yeast8.
We have previously shown that the GATA transcription factor Gaf1 mediates Pol II- and Pol III-mediated transcription downstream of TORC19. Gaf1 is localised mainly in the cytoplasm and upon TORC1 inhibition translocates to the nucleus and binds to target genes9. We examined localisation of Gaf1-GFP (controlled by the endogenous Gaf1 promoter as described in Rodríguez-López et al., 2020). Gaf1-GFP signal is found throughout the cell in untreated cells (Fig. 1G). Treatment with rapamycin and rapalink-1 results in nuclear localisation of Gaf1-GFP within 5 min (Fig. 1G) indicating that both drugs can inhibit TORC1 at sufficient levels to allow Gaf1 dephosphorylation and translocation. One of the major actions of Gaf1 is to repress all the Pol III transcribed tRNAs in fission yeast upon TORC1 inhibition. The result of Gaf1-GFP localisation agrees with Maf1 activation seen through Maf1-pK dephosphorylation (Fig. 1E). Overall, our results show that rapalink-1 primarily targets fission yeast TORC1 and, like rapamycin, can inhibit several but not all aspects of TORC1-dependent functions in the examined concentrations. We cannot exclude the possibility that in higher concentrations or prolonged exposures to the drug, TORC2 will not be affected (as previously has been shown in the case of rapamycin28).
We then assessed the CLS of fission yeast cells when treated with rapamycin and rapalink-1 in YES media and at OD600 0.5 at 100 nM concentration. As expected, rapamycin induces CLS extension (Fig. 1H, log-rank p = 1.25*10−12). Similarly, rapalink-1 prolongs lifespan in similar fashion to rapamycin (Fig. 1I, p = 2.2*10−12) demonstrating the potential of the drug and its action in ageing through TORC1 inhibition. Rapalink-1 lifespan extension depends on fkh1 (Fig. 1J, p = 0.054) as has previously been observed in the case of rapamycin8 and observed here too (Fig. 1J, p = 0.067) demonstrating that the effects of rapalink-1 in these conditions are TORC1-dependent.

Rapalink-1 affects TORC1-related processes in fission yeast and prolongs lifespan. Time course of septation index for untreated (control) and rapamycin and rapalink-1 treated cells (100 nM), as indicated, in YES media. Dotted lines represent average values while coloured ribbons standard deviation from three independent counts.Same as in A in EMM2 minimal media.Time course of cell size upon division measurements following rapamycin and rapalink-1 treatments in YES media. Asterisks indicate statistically significant differences between the compared groups ( < 0.01, wilcoxon testing).Same as described in panel C with the assay conducted in EMM2 media. Asterisks indicate statistically significant differences between the compared groups ( < 0.01, wilcoxon testing).Western blots for markers dependent on TORC1 activity and representative loading controls. Assays have been conducted following 2 and 5 h of treatments with 100 nM rapamycin (Rm) and rapalink-1 (Rl) together with untreated control cells (). NGFP-Atg8 blot, fl: full length, deg: degraded forms; Maf1-pK blot, p: phosphorylated form, de-p: dephosphorylated forms; Gad8-HA blot, p-Gad8: phosphorylated form, Gad8: dephosphorylated form. Numbers above P-eIF2α blot correspond to ratios of phosphorylated versus total eIF2a normalised to the corresponding control (control will, therefore, always be 1). Numbers above Maf1-pK blot correspond to ratios of top (p) band to the second band and normalised with the corresponding control. Numbers above Gad8-HA blot correspond to ratios of the top (p-Gad8) to the bottom band (Gad8) and normalised with the corresponding control.Western blots for Psk1-myc in control, C; nitrogen starvation, -N; rapamycin, Rm and rapalink-1, Rl treatments for 2 and 5 h. Assays have been conducted with the same drug concentrations as in ().DAPI staining and Gaf1-GFP localisation panels in control untreated, rapamycin and rapalink-1 treated cells as indicated. Bar is 10 µm.CLS assays for untreated (control) and rapamycin treated wild-type fission yeast cells (log-rank = 1.25*10, see materials and methods).CLS assays for untreated (control) and rapalink-1 treated wild-type fission yeast cells (log-rank = 2.2*10, see materials and methods).CLS assays for untreated (control), rapalink-1 and rapamycin-treatedmutant cells (log-rank = 0.054 for rapalink-1 and = 0.067 for rapamycin, see materials and methods). A B C D E C F E G H I J p p p p fkh1Δ p p -12 -12
A genome-wide screen for rapalink-1 resistance highlights roles of endosome-related processes in growth and lifespan

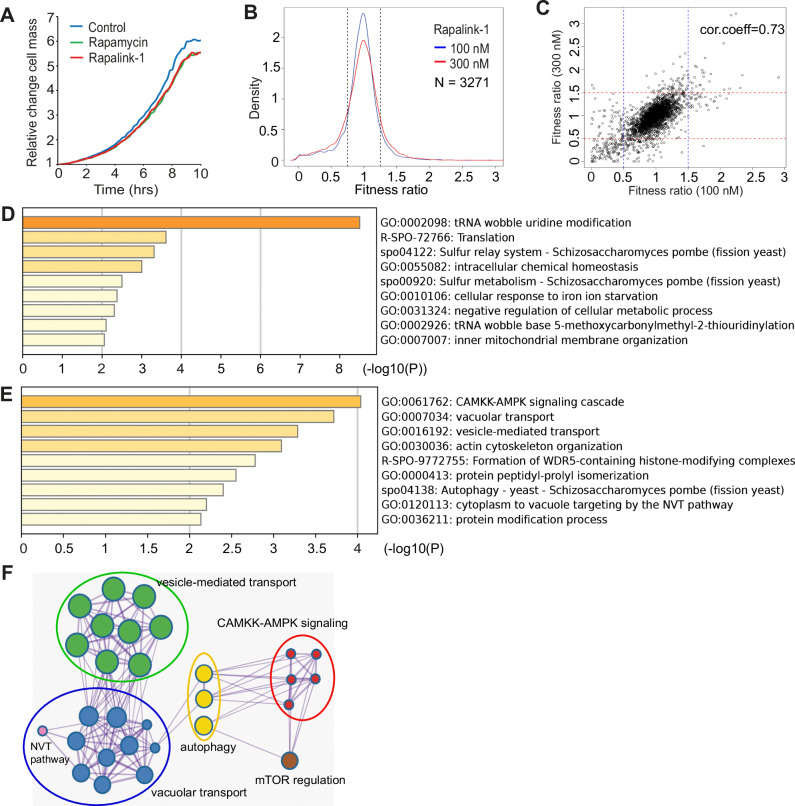
A genome-wide screen for rapalink-1 points to the endosome-vacuole-lysosome network as important in TOR-dependent lifespan regulation. Growth curves for control untreated, rapamycin and rapalink-1 treated wild type fission yeast cells, as indicated. The assay records light scattering dependent on culture cell mass (see materials and methods).Fitness ratio overviews of genome-wide screens (data acquired for 3271 deletion mutants) for rapalink-1 at the indicated concentrations. Vertical dotted lines indicate cutoffs for sensitive and resistant mutants (Supplementary Data 2).Fitness ratio correlation between the two conducted screens. Each point represents the average fitness obtained for a single deletion mutant of the library.Gene ontology enrichment for mutants sensitive to rapalink-1 treatment.Gene ontology enrichment for mutants resistant to rapalink-1 treatment.Network of enriched terms coloured by cluster ID, where nodes that share the same cluster ID are typically close to each other. A B C D E F
Rapalink-1-dependent gene expression points to TORC1-related genes with both known and unknown roles in ageing
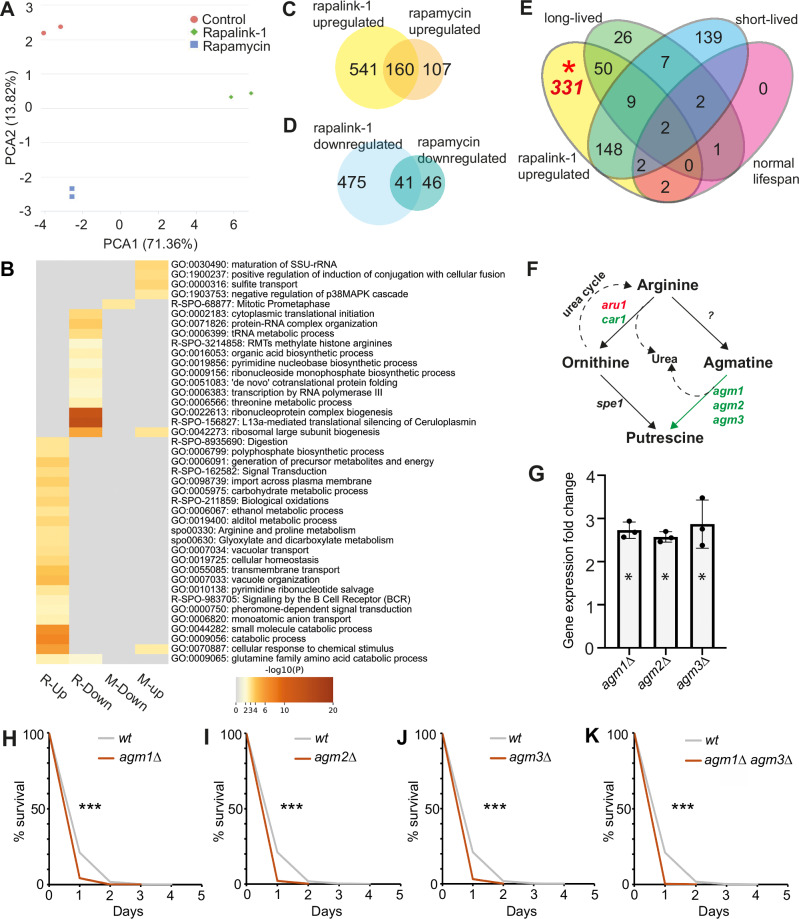
Beyond proteostasis, autophagy and global translation levels, TORC1 activity controls gene expression at the level of transcription through multiple transcription factors5,35,36. We therefore performed RNA-seq analysis on fission yeast cells treated with 100 nM rapamycin and rapalink-1 for 5 h. This timepoint was chosen based on the observed changes in the relevant markers described at Fig. 1E, F.
High-throughput phenotyping approaches have majorly contributed to characterising the CLS of haploid fission yeast mutants33,35. TORC1 is a major pro-ageing pathway, and TORC1-dependent genes are likely to be related in lifespan regulation. We, therefore, examined whether differentially expressed genes from rapalink-1-treated cells are linked with long or short reported lifespans of the corresponding mutants. While many rapalink-1 upregulated genes have reported lifespans, a significant number (331 genes) have no lifespan annotations (Fig. 3E). GO enrichment of these genes demonstrates that they are related to amino acid transport, amide transport, galactose, tyrosine, arginine and proline metabolism (Fig. S3A). Likewise, 150 genes that are found to be downregulated in rapalink-1 treated cells have not been annotated for lifespan (Fig. S3B) and these are related to L13a-mediated translational silencing, ribonucleoside biosynthesis, response to stimulus as well as to alanine, aspartate and glutamate metabolism (Fig. S3C). Examination of upregulated genes not linked yet to lifespan, revealed that arginine catabolism and specifically all the agmatinase enzymes involved in processing agmatine to putrescine are boosted following TORC1 inhibition (Fig. 3F). To validate the results from RNA-seq, we performed qPCRs for all three agmatinases from fast-growing cells (OD600 = 0.5) treated with rapalink-1 for 5 h compared to untreated cells. The results from qPCRs showed a 2.5- to 3-fold increase in all agmatinases, confirming the RNAseq data (Fig. 3G). We therefore wondered whether agmatinases are required for normal CLS in fission yeast. CLS assays reveal that agm1Δ (log rank p = 9.7 × 10⁻⁵, Fig. 3H), agm2Δ (log rank p = 1.5 × 10⁻⁵, Fig. 3I) and agm3Δ (log rank, p = 3.9 × 10⁻⁵, Fig. 3J) mutant cells are short-lived compared to wt cells. In addition, cells mutant for both agm1 and agm3 are also short-lived (log rank p = 3.3 × 10⁻⁶, Fig. 3K). Rapalink-1 prolongs CLS in wt cells (Fig. 1I). But does it have effects on the agmatinase mutants? We therefore performed CLS on single agm mutants with and without rapalink-1 treatments. In all cases rapalink-1 can extend lifespan (Fig. S4A–C), probably due to compensation between the agmatinase enzymes. The lifespan extension for agm2Δ is less pronounced compared to the ones observed for agm1Δ and agm3Δ. Nevertheless, the change is significantly different in all cases (log rank p value < 0.01). We are not able to say whether the differences in rapalink-1-dependent lifespan extension signifie specialisation in agmatinase requirements, but it is plausible.

Gene expression analysis following rapamycin and rapalink-1 treatment reveals novel genes involved in chronological ageing. PCA analysis of control untreated, rapamycin- and rapalink-1-treated cells as indicated.Heatmap of representative GO enrichments for gene lists of upregulated and downregulated genes in the drug treatments used (R-Up: rapalink-1 upregulated; R-Down: rapalink-1downregulated; M-up: rapamycin upregulated; M-down: rapamycin downregulated).Venn diagram for upregulated genes following rapamycin and rapalink-1 treatments.Venn diagram for downregulated genes following rapamycin and rapalink-1 treatments.Venn diagram showing overlaps of rapalink-1 upregulated genes (the portion that corresponding mutants are viable) with genes that their deletions lead to long-lived, short-lived or normal-lived mutants.Schematic of arginine metabolism to ornithine, agmatine and putrescine with genes coding for responsible enzymes. In green: genes that are upregulated, red: downregulated, black: not affected, following rapalink-1 treatment.qPCR validations of RNAseq data related to agmatinases. The bar graph shows fold-change of expression of the agmatinase genes,andin fission yeast following five hours of rapalink-1 treatment compared to untreated controls. Single asterisks (*) within the bar graph indicates student testvalue < 0.01 compared to controls. qPCR reactions were performed in triplicates.() CLS for normal () and mutant(G, log rank = 9.7 × 10),(H, log rank = 1.5 × 10),(I, log rank, = 3.9 × 10), and(J, log rank = 3.3 × 10) cells as indicated. The asterists (***) in lifespans (H-K) indicatevalues < 0.001. A B C D E F G H-K agm1 agm2 agm3 p wt agm1Δ p agm2Δ p agm3Δ p agm1Δ agm3Δ p p -5 -5 -5 -6
Agmatine and putrescine affect growth, metabolism and lifespan

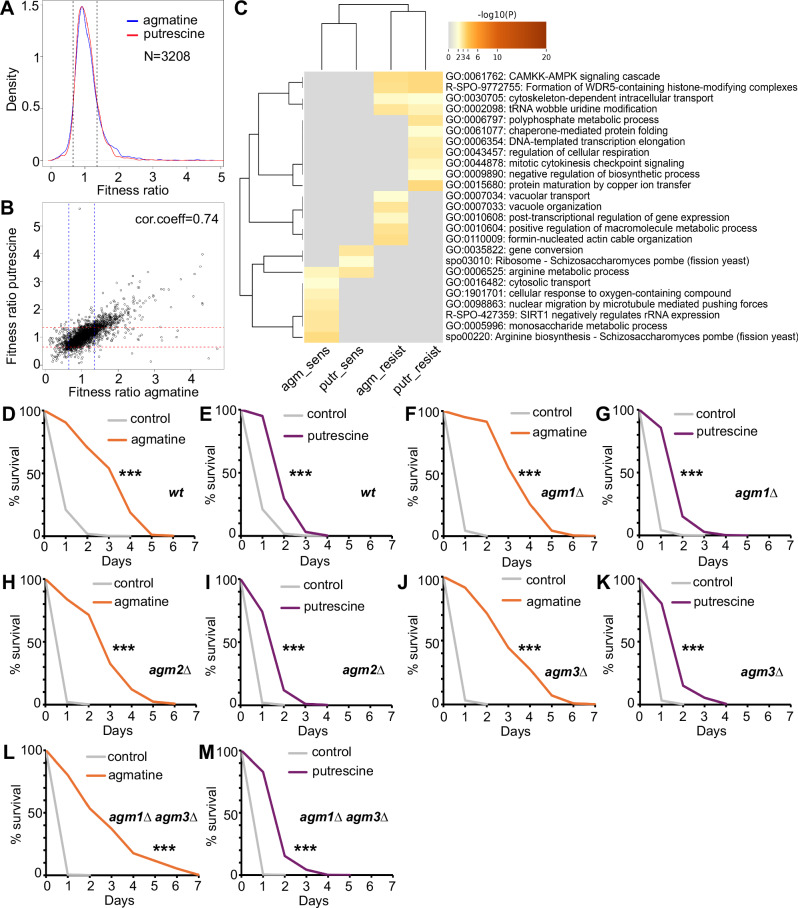
Genome-wide fitness screens of agmatine and putrescine and effects on chronological lifespan of fission yeast. Density profiles of fitness ratios for 3208deletion mutants following agmatine and putrescine treatments.Correlation of fitness ratios of deletion mutants in agmatine and putrescine screens. Each point represents the average fitness value for each mutant.Heatmap of representative Gene Ontology enrichments for mutant strains resistant and sensitive to drug treatments (agm_sens: sensitive to agmatine; putr_sens: sensitive to putrescine; agm_resist: resistant to agmatine; putr_resist: resistant to putrescine).CLS for normal () and agmatinase mutant cells following agmatine and putrescine supplementation during growth phase (see material and methods) as indicated.The three asterisks (***) in lifespans indicatevalues < 0.001, see log rankvalues in the main text. A B C D–M S. pombe wt p p
interactome reveals metabolism-mediated TOR activity regulation with effects on growth and lifespan Agm1
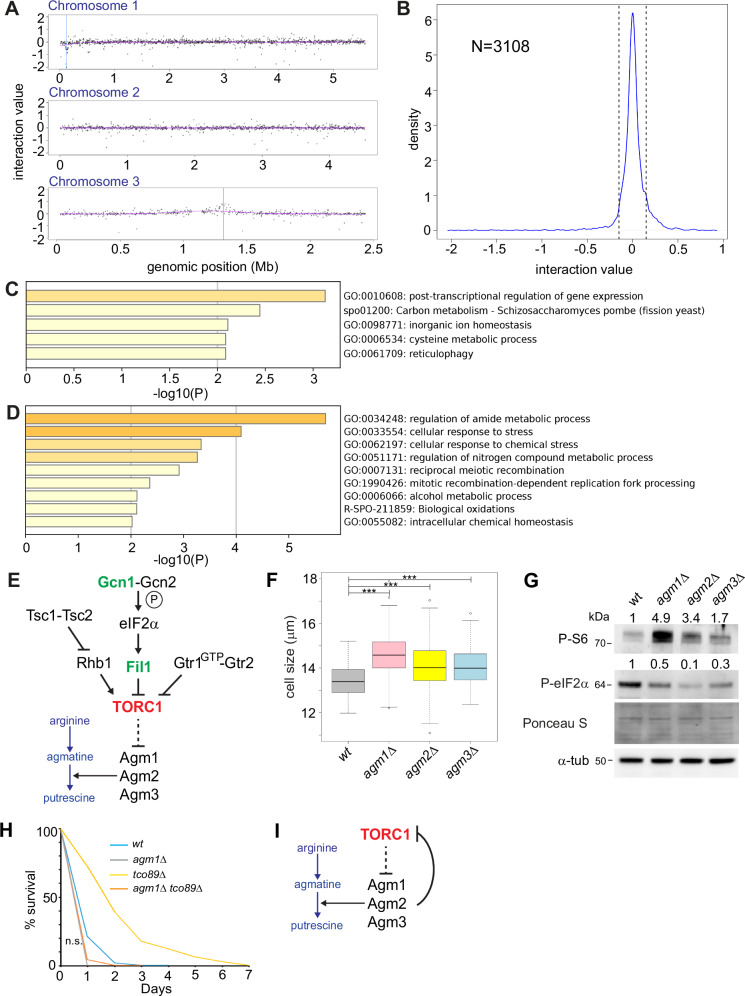
Close inspection of the interactors' list reveals that genes coding for stress and amino acid sensing that inhibit TORC1 such as gcn141 and fil142 positively interact with agm1 (Fig. 5E, green fonts). On the other hand, the TORC1 core component tco893, negatively interacts with agm1 (Fig. 5E, red fonts). These results could mean that the absence of agm1 (and possibly the rest of the agmatinases) promotes growth that is enhanced through the absence of stress response players. The cellular growth enhancement is TORC1-dependent as absence of tco89 results in reduced cellular fitness/growth. Therefore, in this scenario, agmatinases may provide a metabolic regulatory feedback for TORC1 activity in fission yeast: when TOR is inhibited, cells process vacuole-stored amino acids such as arginine43, thus ensuring that TOR inhibition signals are maintained, relayed within the cell and preventing anabolism while preparing for catabolic processes and autophagy. In this case, agm mutants would showcase phenotypes related to increased TORC1 activity. Indeed, we have found that all agmatinase deletion mutants have short chronological lifespans compared to wt cells (Fig. 3H–K). Agm1 mutants have already been reported to be fast-growing44 and to have decreased mating efficiency45, both cellular characteristics of increased TORC1 activity. We have then assessed cell size upon division for normal (wt) and agmatinase mutants. Our results demonstrate that agm mutant cells are larger (Fig. 5F, ***: p < 0.001, Wilcoxon testing) strengthening the case of increased TORC1 levels as the latter controls both temporal and spatial aspect of fission yeast growth. TORC1 activity growth through protein translation via phosphorylation of S6 kinases (such as Sck1, Sck2 and Psk1). Indeed, phospho-S6 activity is increased in agm mutants, almost 5-fold for agm1Δ, 3.4-fold for agm2Δ and 1.7-fold for agm3Δ (Fig. 5G). In addition, P-eIF2α, a negative marker of translation also used for assessing 'stress' levels of cells, is reduced in agm mutants (Fig. 5G, 0.5-fold in agm1Δ, 0.1-fold for agm2Δ and 0.3-fold for agm3Δ). Interestingly, while tco89 mutant cells are long-lived8, agm1Δ tco89Δ are short-lived as single agm1 mutants (Fig. 5H). This result shows that in the case of the CLS phenotype, agm1 is epistatic of tco89. Our data reveal that the agmatinergic branch of arginine catabolism is favoured during TOR inhibition and forms a regulatory loop required for maintaining a lower TOR level, according to what environmental pressures dictate (Fig. 5I).

Genetic interactomes ofreveal a metabolic feedback mechanism that tunes TORC1 activity. agm1 Physical mapping ofinteraction values with 3108 mutants. Blue and red lines indicate the physical location of the query geneand the control query genein thegenome.Density plot of the genome-widegenetic interactions. Vertical dotted lines show the cutoffs set for the interactome analysis (see materials and methods).Bar graph representation of GO enrichments for negativeinteractions.Bar graph representation of GO enrichments for positiveinteractions.Schematic showing a previously reported tripartite TORC1 regulation in fission yeast. Green fonts signify positive while red fonts negative interactions.Cell size upon division measurements in normal (wt) andmutant cells (Δ) in YES media. Asterisks indicate statistically significant differences between the compared groups (p < 0.01, wilcoxon testing).Western blot for P-S6 and P-eIF2α in normal (wt) andmutant cells (Δ) with accompanied α-tubulin western blot and Ponceau S stains as loading controls. Numbers on top of P-S6 and P-eIF2α are ratios of signals to the corresponding tubulin signal and normalised to theratio (thus ratio ofis always 1; measurements were performed using ImageJ).CLS patterns ofmutants is indicated. n.s.: not significant as log rank > 0.05. A schematic model for the revealed role of agmatinase enzymes in tuning TORC1 activity in fission yeast. A B C D E F G H I agm1 agm1 ade6 S. pombe agm1 agm1 agm1 agm agm1Δ, agm2Δ, agm3 agm agm1Δ, agm2Δ, agm3 wt wt agm1Δ and agm1Δ tco89Δ p
Discussion
In this study, we have assessed the cellular and molecular effects of the bi-steric TOR inhibitor rapalink-1 using fission yeast, a genetically tractable eukaryotic model. Our results show that rapalink-1 primarily targets TORC1, prolongs chronological lifespan and demonstrate that TOR activity negatively regulates agmatinase genes. In fast-growing conditions and nutrient availability, TOR is highly active. The cells retain TOR activity, thus enhancing anabolism and promoting growth and, therefore, repressing agmatinase genes and the catabolic processing of arginine pools. This metabolic circuit ensures that arginine, stored within vacuoles43, continues to provide TOR activation input. In stress conditions (including stationary phase and during CLS) and when TOR activity is lower46, cells catabolise arginine. Once again, this ensures that in such conditions, cells upregulate defensive mechanisms, scavenge and recycle nutrients and prevent anabolism. Fission yeast arginases Aru1 and Car1 process arginine to ornithine. Interestingly, upon direct TORC1 inhibition through rapalink-1 the main arginase Aru1 is downregulated while Car1 is upregulated 1.4-fold. Data from the orfeome and global localisation study in fission yeast47 indicate that Aru1 and Car1 are localised in the cytoplasm and the nucleus. Nevertheless, Agm1 and Agm3 (no relevant data on Agm2 are available) are found in the endoplasmic reticulum (note that reticulophagy is a Gene Ontology term for genes interacting with agm1) and the vacuole. Therefore, agmatinase enzymes are localised in the right compartment to control arginine pools crucial for TORC1 activity and fission yeast cells' survival during nutritional and other stresses as well as in the context of lifespan. Taken together, these data and circuits can explain the requirements of the agmatinases in chronological ageing.
Our gene expression analyses have revealed many TORC1-regulated genes with no annotations or characterisation related to ageing and lifespan. Recent studies have focused on broad profiling of fission yeast mutants35 using non-competitive settings. In addition, we and others have performed genome-wide assays13 towards characterising mutants related to lifespan regulation33,44. Despite these efforts and due to the competitive nature of pooled barcode-based assays, only a fraction of the available viable mutants have been characterised. In addition, many medium-or high-throughput lifespan approaches have already been described and conducted in fission yeast29,33,48. Nevertheless, this gap of knowledge remains. Uncovering novel TORC1-regulated genes will focus current and future efforts in discovering new biology within the biogerontology field and beyond.
Parallel to gene expression analyses, we have performed cell-based genome-wide screens to reveal mutants that are sensitive and resistant to rapalink-1, as we have previously reported for torin19. Our data showcase that the beneficial effects of TOR inhibition are related to the endolysosomal pathway and involve ESCRT, HOPS, CORVET, autophagy and the PIK3 complex. Taken together, these results may indicate that these complexes may be required for TOR-dependent lifespan control through inhibitors including rapalink-1, rapamycin and torin1. Recent work has linked the inhibition of S6K with lifespan increase through the endolysosomal system49 showcasing the universal roles of these functional connections in the ageing process.
Interest in agmatine as a nutraceutical is significant, and it is reported as a promising therapeutic agent for treating a broad spectrum of central nervous system-associated diseases50. A large portion of agmatine in mammals is supplemented from diets and gut microbiota, and long-term (5 years) supplementation studies51 have demonstrated its safety in the examined doses. Beneficial effects on the host's lifespan through microbiome-derived agmatine induced by metformin treatment have been previously reported39,52. Indeed, agmatine can augment metformin's therapeutic effects. However, it does not always promote beneficial effects as it can contribute to pathology53. Here we show that a consequence of the direct TORC1 inhibition is the transcriptional activation of all the enzymes that catabolise agmatine to putrescine and urea, with this pathway being vital for viability in non-dividing states. We have performed genome-wide phenomic screens revealing mutant backgrounds that benefit (or not) from agmatine and putrescine treatments. Our results show that supplementations of agmatine and putrescine are beneficial for cellular fitness only when arginine metabolism pathways are intact. This may explain diverse outcomes of agmatine supplementation and possible contributions to pathological conditions that are observed in other studies. Interestingly, both agmatine and putrescine prolong lifespan in wt and agmatinase mutants. Nevertheless, the effects of agmatine are more pronounced compared to putrescine, probably because agmatine can contribute to cellular health in multiple ways, as previously reported, including protecting from mitochondrial dysfunction and promoting the balance between mitochondrial fission and fusion54.
There is a growing interest in polyamines and how they regulate longevity. The triamine spermidine, a natural polyamine, can be generated from both the ornithine and the agmatine axes. In mammalian cells its biosynthesis starts from arginine with the enzyme arginase (ARG1) catalysing the reaction from arginine to ornithine55. Spermidine is well-known to stimulate cytoprotective mechanisms and autophagy56. Spermidine has been implicated with lifespan in yeast and we have previously uncovered longevity alleles and revealed connections of Rim15/Ppk31 with spermidine metabolism19. Recently, spermidine is shown to be pivotal in mediating fasting-induced autophagy in yeast, nematodes and human cells20. Nevertheless, in our present study, we show that agmatinases do not function simply to contribute to putrescine and ultimately spermidine production. While spermidine induces autophagy and mediates hypusination of the translation regulator eIF5A20, agmatinases' induction due to lowering of TORC1 activity levels contribute towards maintaining the low TORC1 activity. Our analyses reveal a metabolic feedback loop mediated through agmatinase enzymes, ensuring that TORC1 activity levels are maintained as required for physiological cell needs and according to the signals received from the environment (nutritional or pharmacological). The revealed metabolic control is required for survival in non-dividing states and in CLS and can have implications and be of importance for human cells. Understanding how TORC1 activity is tuned may be beneficial in both normal ageing and also pathological states as well as in cancer where TOR plays important roles2,57.
Methods
Strains and media
972 h− was used as the wild-type. The strain containing C-terminally GFP-tagged Gaf1 (gaf1-GFP kanMX6) has been generated according to58 with gaf1 being under the control of the endogenous promoter and as in refs. 7,9,59. Strains Maf-1-pK and GFP-atg8 have been previously described23,25. We have also used h+ agm1::kanMX6; h+ agm2::kanMX6; h+ agm3::kanMX6; h+ fkh1::kanMX6; agm1::natMX6 agm3::kanMX6; agm1::natMX6 tco89::kanMX630. Other strains have been obtained from the deletion collection and verified using PCR according to manufacturer's instructions. Microscopy was performed using an EVOS M5000 and Leica DMRA2 epi-fluorescent microscope fitted with a monochrome Orca-ER camera from Hamamatsu Photonics. YES (Yeast extract with supplements) and EMM2 media (Edinburgh Minimal Media 2) (Formedium) are used as indicated in the figures and main text. Drug treatments have been conducted in fast-growing cultures at OD600 0.5 (see main text for details). Liquid cultures were grown at 32 °C with shaking at 130 rpm.
Western blotting
Cells were treated with 100 nM rapamycin or 100 nM rapalink-1 for 2 or 5 h as indicated in figures and main text. Cells were disrupted using RIPA buffer and glass beads in a FastPrep 5 G MP lysis system. Antibodies directed against phospho-eIF2a (#9721, 1:1000), eIF2a (#9722, 1:1000), phospho-Ssp2 (#50081, 1:1000), Phospho-(Ser/Thr) Akt Substrate Antibody (#9611, 1:2000) were purchased from Cell Signalling Technologies. The antibody directed against myc (ab32, 1:1000) was purchased from Abcam while antibodies directed against V5 (sc-81,594, 1:1000) and HA (sc-7392, 1:1000) were purchased from Santa Cruz Biotechnology. Secondary antibodies Goat Anti-Mouse IgG H&L (HRP) (ab205719, 1:5000 in all cases except when V5 and GFP was the primary antibody where it was used at 1:10,000) and Goat Anti-Rabbit IgG H&L (HRP) (ab205718, 1:5000) were purchased from Abcam while the ECL Western Blotting Detection system was from Pierce™. ɑ-tubulin (T5168, 1:1000) and anti-GFP (11814460001, 1:1000) were purchased from Sigma-Aldrich. ɑ-tubulin and Ponceau S staining have been used as loading controls for western blots as and where indicated. Western blotting quantifications have been performed using ImageJ/Fiji29,60.
Cell size and septation index determination
To measure septation index, cells were resuspended in calcofluor solution (#18909, Sigma-Aldrich) and incubated at room temperature for five minutes. Cells were visualised using an EVOS M5000 microscope. Percentages of septation from 200 cells for each time point have been recorded. For cell length at division, measurements of 50–100 septated cells were conducted using Fiji/ImageJ software7,60.
CLS assays
CLS was determined through counting colony-forming units every day and normalising numbers with day zero8. Fission yeast cells are grown to the stationary phase. However, in this study, cells are left for an additional 48 hours as seen in previous related studies15 and then the assay starts with this time point considered as the 100% survival for the time course. Two or three independent biological repeats with each repeat having three technical replicates have been used. Log rank tests are performed for all CLS assays with CFUs and percentages used in the statistical testing. Statistical significance has been also validated with AUC measurements60 as also seen in ref. 9. Lifespan lengths vary largely in yeasts depending on the time point used following stationary phase entry and the media used. Different batches of YES media can generate different lifespan curve patterns depending on the Yeast Extract used in the particular batch. We have used a unique YES batch (Formedium) throughout the study.
RNA sequencing data
Untreated as well as rapamycin and rapalink-1 treated cells (treatment was at OD600 = 0.5) for 5 h were harvested and processed for RNA isolation8 using acidic phenol-chloroform extraction method followed by RNAeasy (Qiagen) cleanup with on column DNase treatments before double elution. Following appropriate quality control steps, RNA library formed by polyA capture and Illumina 150 bp paired-end sequencing followed by standard R-based bioinformatic analysis was performed. Differential gene expression analysis of two conditions/groups (two biological replicates per condition) was performed using DESeq2R package (1.20.0). Genes with an adjusted P value <=0.05 found by DESeq2 and at various fold cutoffs (see main text) were assigned as differentially expressed. Sequences are deposited at GEO (accession number: GSE272269).
Quantitative PCRs
As in the case for RNA sequencing untreated as well as rapalink-1 treated cells (at OD600 = 0.5, treatment for 5 h) were harvested and processed for RNA isolation8 using acidic phenol-chloroform extraction method followed by RNAeasy (Qiagen) cleanup with on column DNase treatments before double elution. cDNA was prepared using LunaScript® (NEB) while qPCR reactions were conducted on a QIAquant96 2plex cycler (Qiagen) using Luna® (NEB) according to the manufacturer's instructions. Fold-changes of expression were calculated using the Ct method and normalising with alpha-tubulin 2 (atb2). Primers used are: agm1L1: 5'-TTTTGGAGGCGGCAAATCAA-3'; agm1R1: 5'-CCAACTCTGTCACGGATCCT-3'; agm2L1: 5'-TACTGTGCTTCCTCGAGTCC-3'; agm2R1: 5'-CCATCTGCTTCATCGCCATC-3'; agm3L1: 5'-TGATCAACAACGGCACATCC-3'; agm3R1: 5'-GCCAATCCAGGATCGACAAC-3'; atb2L1: 5'-TTCTGTGTATCCGGCTCCTC-3'; atb2R1: 5'-AGAGGCGGTGATGGAAGAAA-3.
High-throughput phenomics screens
The deletion library30 was arrayed on solid YES media at 1536-spot density, with each strain represented by four spots with various concentrations of drugs as indicated for each assay. Plates were incubated at 32 °C and high-resolution images of the plates were acquired. Colony size quantitations were then performed using the R package Gitter61. Median colony sizes were calculated for each plate and replicate. Strain colony size data per condition were normalised to the corresponding growth on YES.
Synthetic genetic arrays
SGAs were performed using the Bioneer v5.0 haploid library30 with each interaction examined in quadruplicate7. Query strains were the following: h− agm1::natMX6, and control query h− ade6::natMX6. Colony size was used as a proxy for double mutant fitness. Colony size measurements were obtained using the gitter package61. Library mutants that fell within 30 kb distance of query mutations were excluded from the respective datasets to avoid spurious interactions as well as mutants for which the ade6 double mutant colony size was less than 50 pixels as they were deemed to be present in too little amount for accurate interaction values to be calculated. Colony sizes were normalised to the plate median accounting for the effect of the query mutation and plate-specific effects and normalised for column- or row-specific effects. Medians of colony sizes of the SGAs were normalised with respect to the ade6 SGA (which represents fitness of library single mutants as this query does not affect the library) to calculate the value of genetic interactions between query and library mutants. Interactions with high within-replicate variability were excluded. Finally, the logarithms in base 10 of the interaction were used for interaction scores.
Enrichment analyses of interactions
Enrichment analyses were performed using Metascape62. p-values were corrected for multiple tests according to FDR. Enrichment analysis was conducted by comparing lists of interacting genes to all genes in the dataset (Bioneer v5.0 collection strains30).
Statistics and reproducibility
CLS assays have been performed in two or three biological repeats with 3 technical repeats for each biological repeat. Statistical differences were determined using log-rank tests. Cell sizes have been determined through measurements of 200 cells, while statistical differences were determined using Wilcoxon testing. qPCRs were performed in three biological replicates while statistical differences are determined using student's t test. SGA data have been collected through quadruplicates for each mutant. Processing and normalisations are described in the corresponding paragraph of the Materials and Methods. p-values for RNAseq and Gene ontology enrichments have been determined through standard methods and were corrected for multiple tests according to FDR.
Reporting summary
Further information on research design is available in the linked to this article. Nature Portfolio Reporting Summary
Supplementary information
Transparent Peer Review file Supplementary Information description of additional supplementary files Supplementary Data 1 Supplementary Data 2 Supplementary Data 3 Supplementary Data 4 Supplementary Data 5 Supplementary Data 6 Supplementary Data 7 Supplementary Data 8 Reporting summary