
What this is
- This research explores the formation of a on () synthesized from stearic acid using dual surfactants.
- It examines how the affects drug release dynamics and antibacterial efficacy of ceftriaxone-loaded .
- The findings emphasize the importance of nanoparticle surface charge and surfactant composition in modulating protein interactions and drug delivery.
Essence
- formation on significantly influences drug release and antibacterial efficacy. Higher negative surface charge correlates with increased protein adsorption, which reduces cumulative drug release by 6%.
Key takeaways
- Protein adsorption on is influenced by surface charge; formulations with more negative zeta potentials adsorbed higher amounts of protein.
- The reduced cumulative drug release by 6%, impacting the efficacy of ceftriaxone against bacterial strains.
- Higher concentrations of SDS in the formulation decreased overall formation, indicating a dual role of surfactants in nanoparticle stabilization and protein interaction.
Caveats
- The study primarily focuses on in vitro conditions, which may not fully represent in vivo behavior of in biological systems.
- Further research is needed to characterize the biological roles of proteins in the corona to enhance targeted drug delivery strategies.
Definitions
- Protein corona: A layer of proteins that adsorb onto the surface of nanoparticles, influencing their behavior in biological environments.
- Solid lipid nanoparticles (SLNs): Nanoparticles made from solid lipids that serve as carriers for drug delivery, offering advantages like biocompatibility and controlled release.
Simplified
Background
Solid lipid nanoparticles (SLNs) have been in use as pharmaceutical nanocarriers since 1996, as approved by the FDA [1]. Amongst the various medicinal fields of application, drug delivery of antibiotics has been a branch of interest. Solid lipid nanoparticles exhibit a myriad of favourable properties ranging from high drug encapsulation [2], good drug release kinetics [3], biocompatibility [4], biodegradability [5] etc. Within the context of microbiology, solid lipid nanoparticles have been identified to reduce antimicrobial resistance (AMR) via reduction in biofilm formation [6], improving cellular uptake [7], reduction in pump mediated drug expulsion [8] and bypassing the effect of antibiotic-modifying enzymes [9]. SLNs are usually surfactant stabilized which in turn enables them to be solid at even room temperature [10]. The surfactant also plays a role in reducing surface tension and enhancing drug encapsulation. Solid lipid nanoparticles are commonly synthesized with one surfactant [10] however, synthesis with two surfactants has proved advantageous [11].
Ceftriaxone (CTX) is a third generation cephalosporin whose anti-bacterial efficacy almost 30 years ago cut across even antibiotic resistant strains [12]. In the early 2010s it was noted that ceftriaxone was losing its potency against even the microbial strains previously susceptible to the drug [13, 14]. In an endeavour to thwart antimicrobial resistance (AMR), the use of pharmaceutical carriers in antibiotic delivery has been explored over the past years. In particular, pharmaceutical nanocarriers have presented a new avenue in the fight against multiple drug resistant (MDR) bacteria [15]. Nanocarriers protect antibiotics like ceftriaxone from enzymatic degradation by bacterial enzymes prior to therapeutic action [16] and facilitate penetration through the biofilm matrix [17]. Whilst they can be used on their own as antibacterial agents to combat AMR, pharmaceutical nanocarriers (nanoparticles) have been used as drug delivery agents, hence the term 'carrier' [18]. Combining both the potential antibacterial efficacy of the carrier and the drug, a promising solution to AMR can be attained.
In the recent years, researchers have investigated the behaviour and interactions of nanocarriers in vitro and in vivo. The formation of a biofilm comprised of lipids, sugars but mainly proteins around the surface of these nanocarriers, dubbed the protein corona, has been well documented [19]. This protein corona can be both advantageous and disadvantageous with regards to the intended use of the nanocarrier. The protein corona can enable cellular uptake and boost hemocompatability in organisms [20, 21]. On the other hand, the formation of a thin layer of protein around the surface of the nanocarriers can inhibit the interaction of the nanocarrier and the surface of the bacteria in the case of AMR and also alter the drug release profile of the nanocarrier [22]. In vitro studies involving the protein corona are important as they provide a better control of the numerous variables associated with protein corona formation thereby enabling more precise mechanistic insights that can inform correlation with in vivo outcomes [23]. For preliminary physicochemical investigations, bovine serum albumin (BSA) is frequently employed as it is cost-effective and structurally comparable alternative to human serum albumin (HSA) as they share 76% identity [24].
Bioinformatics, an ever-evolving field, has allowed us to better understand the interaction mechanisms on a molecular level. Molecular docking, an in silico process, uses computational visualizations to view protein-ligand interactions [25]. In the present work, molecular docking was employed to corroborate experimental observations of protein corona formation on SLNs.
This study investigates the formation of the protein corona on SLNs synthesized from stearic acid using two surfactants. While SLNs are conventionally prepared with a single surfactant [26], dual surfactant systems have been shown to improve stability e.g., sodium dodecyl sulphate (SDS) can increase nanoparticle stability in suspension. Following protein corona formation, the effect of ceftriaxone delivery was evaluated against two bacterial strains: Staphylococcus Aureus and Pseudomonas Aeruginosa.
Methods
Preparation of solid lipid nanoparticles (SLN), ceftriaxone-loaded solid lipid nanoparticles (CTX-SLN) and ceftriaxone loaded solid lipid nanoparticles with protein corona (FBS-CTX-SLN)
| Formulation code | Tween 80 concentration (%v/v) | SDS concentration (%w/v) | Stearic acid amount (mg) | Homogenization speed (rpm) |
|---|---|---|---|---|
| SLN-1 | 0.5 | 0.5 | 100 | 11000 |
| SLN-2 | 0.75 | 0.5 | 100 | 11000 |
| SLN-3 | 1 | 0.5 | 100 | 11000 |
| SLN-4 | 0.5 | 0.75 | 100 | 11000 |
| SLN-5 | 0.5 | 1 | 100 | 11000 |
Particle size and zeta potential
The size and zeta potential of all five formulations of nanoparticles were analysed using the Malvern ZTS1240. The results of the size and zeta potential are represented mean of two measurements run twice.
FTIR
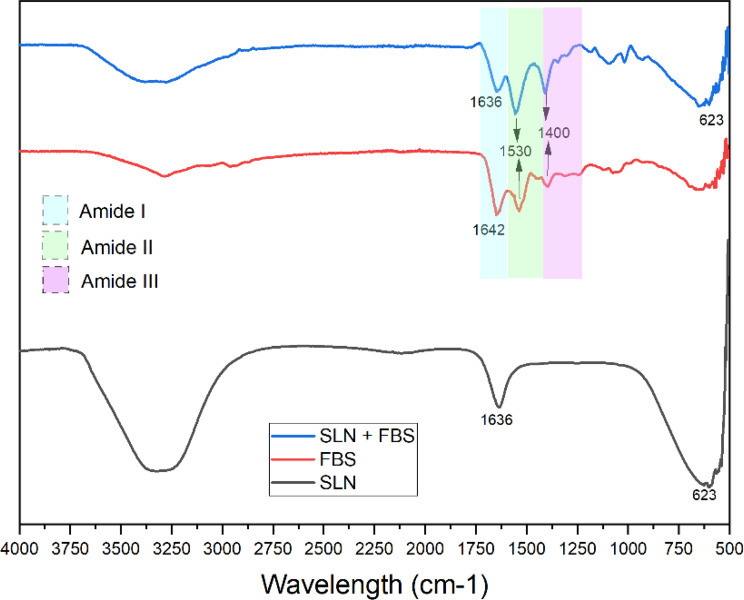
To confirm protein corona formation, the functional groups of stearic acid solid lipid nanoparticles (SLN), foetal bovine serum (FBS), and protein corona modified solid lipid nanoparticles (FBS-SLN) were identified using Fourier Transform Infrared Spectroscopy (Shimadzu).
Ultra-violet visible (UV-Vis) spectrophotometry
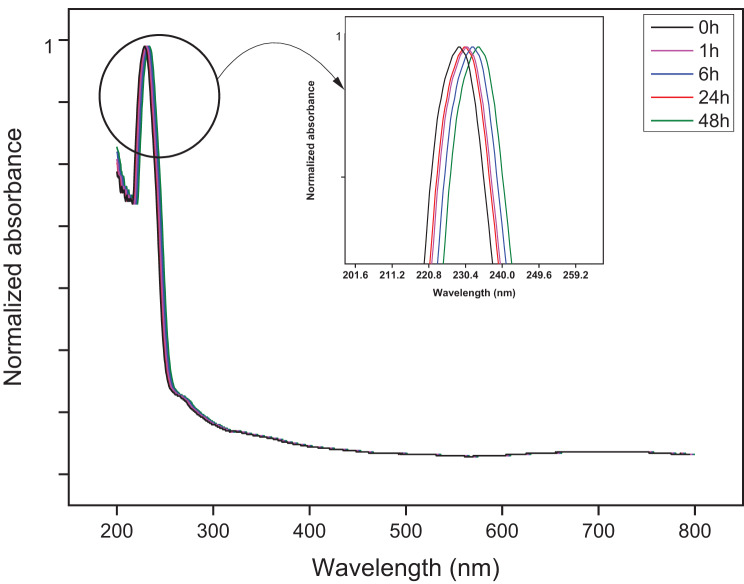
To examine the time progression of the interaction of protein with the solid lipid nanoparticles, UV-Vis spectrophotometry was performed using an Ultra-violet Visible Spectrophotometer (Shimadzu, Japan).
Interaction mechanism
To be able to analyse the content of both Tween 80 and SDS present in the lipid nanoparticles, a UV-Vis spectrophotometry method was used [27]. Calibration curves for both Tween 80 and SDS were prepared. The solid lipid nanoparticles were ultra-sonicated in water for a period of five minutes and filtered through a 0.45 µm Whatman filter. The absorbances were measured at 243 nm and 650 nm for Tween 80 and SDS respectively. The content of Tween 80 and SDS in the nanoparticles was then calculated.
Incubation with foetal bovine serum (FBS)
The five different formulations of stearic acid nanoparticles were each incubated in 5%FBS concentration dissolved in Dulbecco's Modified Eagle Medium (DMEM) media to mimic cellular like conditions in in vitro experiments. The incubation times were 1 hr, 6 hr, 24 hr and 48hrs shaking at 100rpm at 37 °C.
Protein corona elution and protein content analysis
After incubation, the nanoparticles in protein solution were centrifuged at 13000rpm for 10 minutes. The nanoparticles were washed twice in PBS (pH 7.4). The protein corona was eluted using a 1 M Tris-HCl-SDS solution at pH 7.4. The eluted protein was analysed for total protein content using the Bradford 96-well plate Assay.
Protein adsorption
The main protein present in FBS is bovine serum albumin (BSA). To assess the mechanism of protein adsorption on the surface of the nanoparticles, all five formulations of nanoparticles were incubated with BSA. Different concentrations of BSA ranging from 1 to 100 µM were prepared and incubated with each formulation of nanoparticle for 45 minutes. The hydrodynamic sizes of the nanoparticles before and after incubation were measured and by using the Hill equation, the binding affinities and Hill co-efficient were determined.
In silico evaluation
To further analyse the binding interaction between the main protein present in FBS, bovine serum albumin (BSA), and the two surfactants, Tween 80 and SDS, a molecular docking approach was used. BSA with PDB ID 3V03 was downloaded from the Protein Data Bank [28]. Docking was performed with AutoDock Tools version 1.5.7. Prior to the docking procedure, the protein was prepared by removing water molecules, adding polar hydrogens and Kollman charges were assigned [29]. The ligand structures were downloaded from PubChem, Tween 80 (PubChem SID 481110309) and SDS (PubChem CID 3423265). Docking was performed using the default parameters and a large grid box (126 ×126 x 126) with a grid box spacing of 0.519Å to allow free movement around the protein. To analyse the ligand-protein interactions further, Pymol version 3.1.1. was used.
Drug encapsulation, drug loading and drug leakage
Ceftriaxone (CTX) presents a maximum absorbance at 241 nm via spectrophotometry. A calibration curve of the drug was constructed. Immediately after synthesis, the drug loaded nanoparticles were centrifuged at 8000 rpm. To quantify the amount of ceftriaxone encapsulated by the solid lipid nanoparticles, the supernatant of the CTX-loaded nanoparticles was collected and the absorbance at 241 nm was measured (Nanophotometer, Implen). This absorbance will determine the amount free drug present in the solution. In order to calculate the amount of ceftriaxone encapsulated in the solid lipid nanoparticles, the following formula was used: \documentclass[12pt]{minimal} \usepackage{amsmath} \usepackage{wasysym} \usepackage{amsfonts} \usepackage{amssymb} \usepackage{amsbsy} \usepackage{mathrsfs} \usepackage{upgreek} \setlength{\oddsidemargin}{-69pt} \begin{document}$${\rm{\% }}drug\,encapsulated = {{total\,drug - free\,drug} \over {total\,drug}}\times100$$\end{document}
The drug loaded nanoparticles were dried and weighed to quantify the drug loading. Drug loading expresses the proportion of the drug's weight relative the drug-loaded system and is calculated using the following formula: \documentclass[12pt]{minimal} \usepackage{amsmath} \usepackage{wasysym} \usepackage{amsfonts} \usepackage{amssymb} \usepackage{amsbsy} \usepackage{mathrsfs} \usepackage{upgreek} \setlength{\oddsidemargin}{-69pt} \begin{document}$${\rm{\% }}drug\,loading = {{weight\,of\,entrapped\,drug} \over {weight\,of\,nanoparticles}}\times100$$\end{document}
An investigation on drug leakage on CTX-loaded lipid nanoparticles and FBS-CTX-lipid nanoparticles was performed by suspending the solid lipid nanoparticles in distilled water and stirring rapidly for 15 minutes. The samples were then centrifuged at 8 000rpm and the supernatant analysed for drug content via spectrophotometry.
In vitro drug release
The in vitro release was evaluated using the dialysis bag method for 72 hours. A 30kDa was loaded with CTX-loaded nanoparticles and FBS-CTX-loaded nanoparticles was dissolved in 1X PBS (pH 7.4) and placed in a beaker containing 1X PBS (pH 7.4). (Separate dialysis bags and beakers were used). The beaker was subjected to agitation of 100rpm at a temperature of 37 °C. At established time intervals, 1 ml of solution from the beaker was pipetted from the beaker and replaced with fresh PBS solution. The pipetted solution was analysed for drug content. The drug content at the established time intervals was used to construct in vitro release graphs. The cumulative release data was also utilized to analyse the drug release kinetics.
Kirby-Bauer test
One colony of each of the two strains of bacteria, Staphylococcus Aureus and Pseudomonas Aeruginosa, were cultured overnight in nutrient broth at 37 °C. The bacteria were normalized at 600 nm to OD 0.1 and calculated amounts were spread across Mueller-Hinton agar plates. Discs containing 10 µl of the SLN, SLN-CTX and FBS-SLN-CTX formulations dissolved in PBS, PBS (negative control) and ceftriaxone (positive control) were placed equidistant on the agar plates. The plates were incubated overnight and zones of inhibition were measured and recorded.
Results and discussion
Size and zeta potential
| Formulation code | Size (nm) | Zeta potential (mV) | PDI | |
|---|---|---|---|---|
| SLN-1 | 198.3 ± 0.98 | −36.2 ± 0.07 | 0.4609 | |
| SLN-2 | 155 ± 1.01 | −30.97 ± 0.12 | 0.4767 | |
| SLN-3 | 204.8 ± 0.87 | −21.56 ± 0.31 | 0.5141 | |
| SLN-4 | 274.9 ± 1.24 | −24.56 ± 0.14 | 0.5036 | |
| SLN-5 | 264.8 ± 0.96 | −23.28 ± 0.09 | 0.498 | |
Size and zeta potential changes after incubation

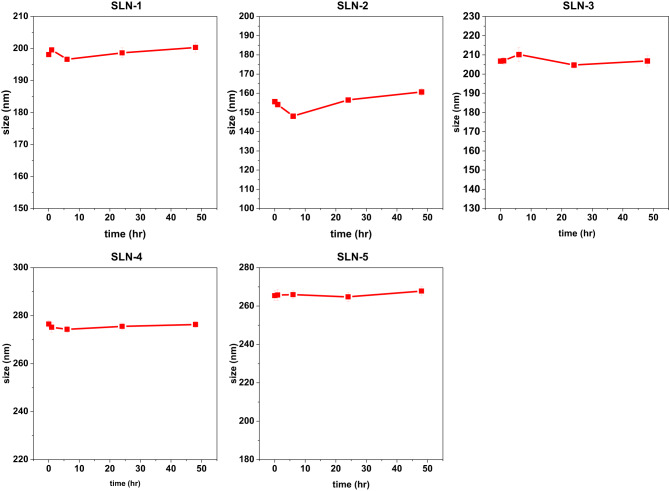
Size changes of nanoparticles after 48hrs of incubation with 5% FBS. Data is presented as mean size change ±SD ( = 3) n

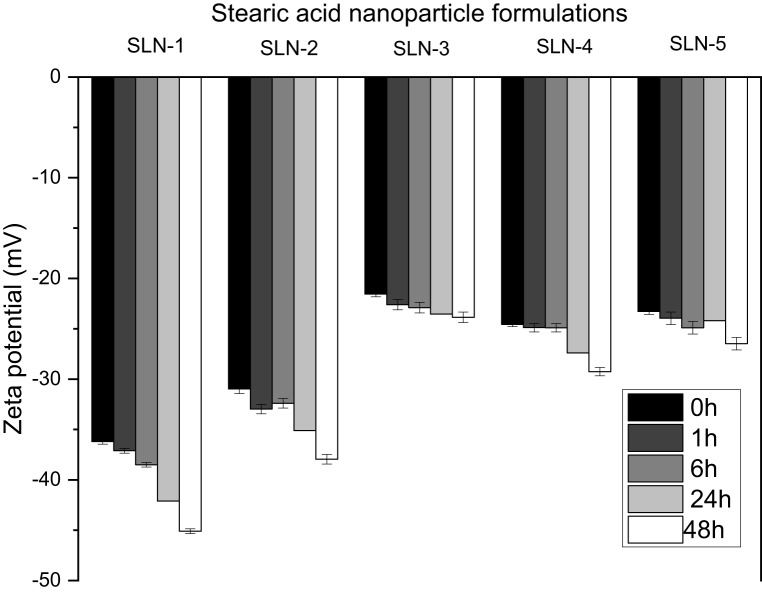
Surface charge changes of stearic acid nanoparticles after incubation in DMEM supplemented with 5% FBS at 0 h, 1 h, 6 h, 24 h and 48 h of incubation. Error bars indicate the standard error calculated from three repeats
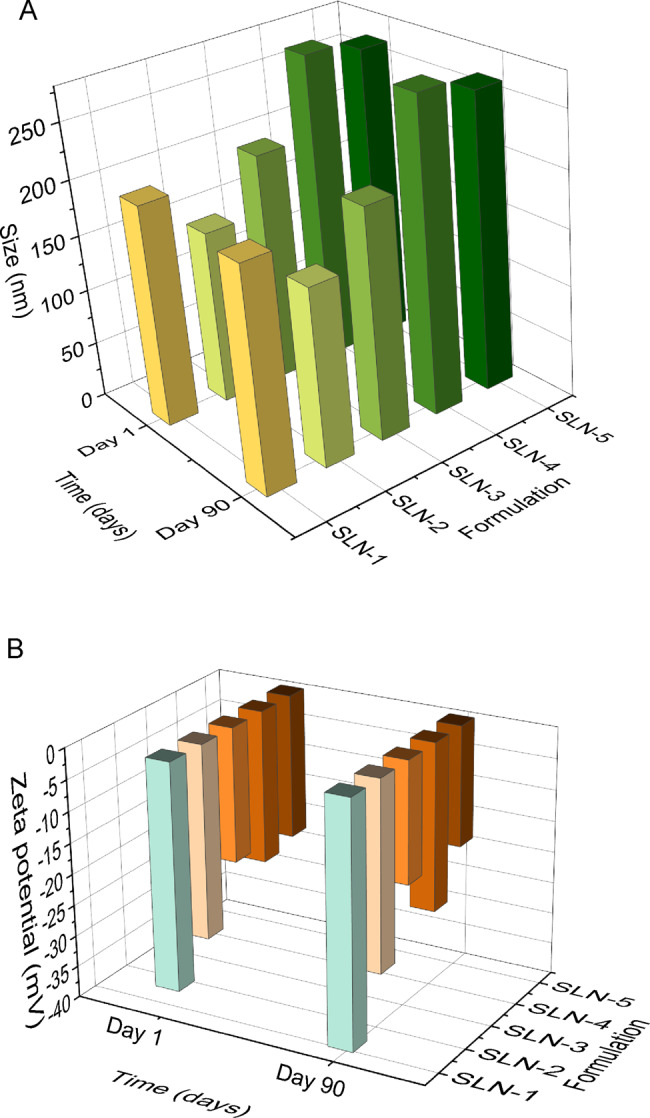
Colloidal stability of stearic acid nanoparticles after 90 days

A shows the mean sizes ( = 3) on day 1 and after 90 days of storage of the 5 formulations (SLN-1 to SLN-5). B shows the mean zeta potential ( = 3) after 90 days of storage of the 5 formulations (SLN-1 to SLN-5). The lipid nanoparticles were stored at 4 °C n n
FTIR

FTIR spectra of stearic acid nanoparticles
UV-Vis absorption spectra

Normalized UV-Vis spectra of the solid lipid nanoparticles after intervals of incubation with 5% FBS. All five formulations exhibited the same spectra
The interaction of proteins with tween 80 and SDS
| Formulation | Content of Tween 80(%v/v) ±SD | Content of SDS(%w/v) ±SD |
|---|---|---|
| SLN-1 | 0.0231±0.43 | 0.0852±0.34 |
| SLN-2 | 0.0671±0.04 | 0.1054±0.28 |
| SLN-3 | 0.10297±0.17 | 0.1154±0.15 |
| SLN-4 | 0.0193±0.32 | 0.1425±0.03 |
| SLN-5 | 0.0263±0.07 | 0.1871±0.45 |
Protein adsorption
The generally implemented strategy in research pertaining to the study of protein corona formation on nanoparticles is to expose the nanoparticle of interest to a biological fluid, harvest the nanoparticle from the fluid and eventually study the adsorbed layer. The processes that lie in between the harvest and study of the layer tend to be abrasive and rough e.g., centrifugation at very high speeds. This is done to ensure the protein corona is made of only those proteins which are bound onto the surface of the nanoparticle and all unbound protein is not included in the analysis.
To largely explain the adsorption of proteins on the surface of nano-sized particles, the Hill Equation [44] is employed. The Hill Eq. (1) states that the surface coverage of the nanoparticle by protein (θ) is dependent on the concentration of the protein [P] which gives rise to the Hill coefficient (n) and the dissociation constant (K'D): 1\documentclass[12pt]{minimal} \usepackage{amsmath} \usepackage{wasysym} \usepackage{amsfonts} \usepackage{amssymb} \usepackage{amsbsy} \usepackage{mathrsfs} \usepackage{upgreek} \setlength{\oddsidemargin}{-69pt} \begin{document}$$\theta = {{{{\left[ P \right]}^n}} \over {{{\left[ P \right]}^n} + K{^{\prime}}{D^n}}}$$\end{document}
The dissociation constant conveys where the protein concentration is at half coverage (50% of the binding sites are occupied; quantifying the strength of the NP-protein interface. The Hill is a measure of the steepness of the curves constructed and consequently explains the manner of cooperativity binding. For binding to be considered non-cooperative, binding is independent to the number of ligands bound to the protein, and the n value is 1 [45]. When the n value is greater than 1, there is positive cooperative binding whilst an n value less than one indicates the opposite. Relating the hydrodynamic size of the nanoparticles (dz) and their subsequent hydrodynamic change in size (Δdz) to the Hill equation gives rise to the following equation: 2\documentclass[12pt]{minimal} \usepackage{amsmath} \usepackage{wasysym} \usepackage{amsfonts} \usepackage{amssymb} \usepackage{amsbsy} \usepackage{mathrsfs} \usepackage{upgreek} \setlength{\oddsidemargin}{-69pt} \begin{document}$${d_z}[P] = {d_z}{(0)^3}\sqrt {{{1 + c\, \cdot \,{{[P]}^n}} \over {{{[P]}^n} + {{({{K{^{\prime}}}_D})}^n}}}} $$\end{document}

DLS curves relating diameter change and BSA concentration using the hill Eq. () 2
| Nanoparticle formulation | K'D | n | R2 |
|---|---|---|---|
| SLN-1 | 163.8 | 1.23 | 0.9908 |
| SLN-2 | 87.9 | 1.42 | 0.9903 |
| SLN-3 | 109.5 | 1.03 | 0.936 |
| SLN-4 | 94.2 | 1.32 | 0.992 |
| SLN-5 | 88.3 | 1.3 | 0.978 |
In-silico evaluation
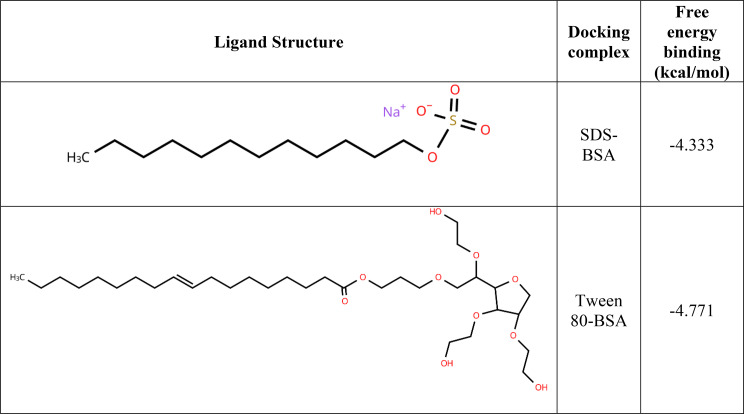
Molecular docking assisted with understanding the strength of the binding affinities of the surfactants to the protein. Molecular docking calculated free energy binding values measured in kcal/mol. Docking simulations results that are greater than 0 kcal/mol indicate an either low or lack of binding affinity for BSA [48]. A binding affinity less than 0 kcal/mol is considered to represent the opposite; medium-high binding affinity. The two ligands in this study (surfactants) both presented binding energies less than 0 kcal/mol as seen in Table 5. This points to a favourable interaction between both ligand and protein.

Binding site residues: () - SDS-BSA complex and () - Tween 80-BSA complex. Both the BSA residues and the surfactant were represented as sticks. Black arrows show the polar interactions indicated by cyan dotted lines. The surfactants in both Fig.andare shown in yellow A B A B
Protein content analysis
The relationship between surface charge and total protein present in the protein corona was evident in these results. SLN-1 which exhibited the lowest surface charge adsorbed more protein on its surface as compared to SLN-3 which has a comparatively higher surface charge. The results of the total protein content tie in with the fact that there is an established link between negative surface charge and more protein corona formation [52, 53]. Another study also reported a −19 mV decrease in zeta potential by adsorption of proteins on the surface of negatively charged solid lipid nanoparticles [54]. The presence of stearic acid, a fatty acid containing a carboxylic group, along with the surfactant used in the formulation contributes to this negative surface charge. Negatively charged nanoparticles adsorb more two to three times more protein than positive nanoparticles. The composition of the protein corona found in negatively charged protein corona are comprised of opsonins and dysopsonins. This enhanced adsorption may present drawback as negatively charged nanoparticles often display lower cellular internalization compared to the positively charged nanoparticle systems [55]. Thus, to facilitate cell up-take without use of surface loaded ligands, the protein corona can be used to increase the rate of cell up-take of SLNs by pre-coating [56]. Furthermore, the protein corona will also assist in prolonging the circulation time as certain proteins like dysopsonins which shield the nanoparticle form rapid clearance, allowing for a better performance in vivo.

Total protein content harvested by elution from the surface of the solid lipid nanoparticles over the 48 h period at 1 h, 6 h, 24 h and 48 h intervals. The results plotted are mean values of three different trials
Encapsulation efficiency and drug loading capacity
| Formulation | EE% | DL% |
|---|---|---|
| SLN-1 | 96.70 ± 0.0190 | 21.3 ± 0.04 |
| SLN-2 | 97.00 ± 0.0115 | 19.8 ± 0.12 |
| SLN-3 | 96.96 ± 0.0055 | 27.2 ± 0.18 |
| SLN-4 | 96.96 ± 0.0125 | 23.1 ± 0.06 |
| SLN-5 | 96.81 ± 0.0150 | 23.9 ± 0.09 |
Drug leakage from CTX-SLN and FBS-CTX-SLN

Percentage drug leakage in both CTX-SLN and FBS-CTX-SLN
Cumulative drug release and drug release kinetics

A contrast between the cumulative drug release over 48 hours of all five formulations of ceftriaxone loaded solid lipid nanoparticles, with protein corona (FBS-CTX-SLN) and without protein corona (CTX-SLN). Drug release is shown as follows: ()-SLN-1; ()-SLN-2; ()-SLN-3; ()-SLN-4; ()-SLN-5 A B C D E
| Formulation | R2 | ||||
|---|---|---|---|---|---|
| Zero Order | First Order | Korsmeyer and Peppas | Hixson-Crowell | Higuchi | |
| CTX-SLN-1 | 0.6513 | 0.8145 | 0.9577 | 0.9847 | 0.8951 |
| FBS-CTX-SLN-1 | 0.692 | 0.7939 | 0.9534 | 0.9929 | 0.9061 |
| CTX-SLN-2 | 0.6981 | 0.8445 | 0.9356 | 0.9858 | 0.9257 |
| FBS-CTX-SLN-2 | 0.6996 | 0.8033 | 0.9692 | 0.9926 | 0.9144 |
| CTX-SLN-3 | 0.7091 | 0.8382 | 0.962 | 0.9884 | 0.9346 |
| FBS-CTX-SLN-3 | 0.7341 | 0.8179 | 0.9247 | 0.9931 | 0.9127 |
| CTX-SLN-4 | 0.6563 | 0.8091 | 0.949 | 0.9858 | 0.9005 |
| FBS-CTX-SLN-4 | 0.7632 | 0.9832 | 0.9239 | 0.9926 | 0.946 |
| CTX-SLN-5 | 0.7029 | 0.8359 | 0.9223 | 0.9878 | 0.9291 |
| FBS-CTX-SLN-5 | 0.7364 | 0.8116 | 0.9269 | 0.9943 | 0.9164 |
Kirby-Bauer test

A graphical representation of the zones of inhibition by the SLN formulations. 'Empty' denotes SLN formulations without ceftriaxone

Images of the zones of inhibition for both bacterial strains. Petri dishes were organized in columns with similarly labelled fifths for each bacterial strain follows: Column I→A, B, C, CTX and PBS; Columns II → D, E, F, G, CTX and PBS; Column III → H, I, J, CTX and PBS; Column IV → S1, S2, S3, CTX and PBS; Column V → S4, S5, blank, CTX and PBS. The labels on the petri dishes are to be interpreted as follows: CTX-ceftriaxone, PBS-phosphate buffer saline solution, A→FBS-CTX-SLN-1, B→FBS-CTX-SLN-2, C→FBS-CTX-SLN-3, D→FBS-CTX-SLN-4, E→FBS-CTX-SLN-5, F→CTX-SLN-1, G→CTX-SLN-2, H→CTX-SLN-3, I→CTX-SLN-4, J-CTX-SLN-5, S1-S5 → empty (drug unloaded SLN-1-SLN-5 formulations)
Conclusion
In conclusion, the study confirmed the presence of the protein corona on stearic acid nanoparticles. The classic exchange of proteins on the nanoparticle surface between soft corona and hard corona was evidenced through both the UV-Vis spectroscopic analysis and Bradford Assay quantification. A clear relationship between nanoparticle surface charge and protein adsorption was established whereby nanoparticles with more negative zeta potential adsorbed greater quantities of protein. Prolonged incubation with foetal bovine serum (FBS) resulted in a gradual increase in the negative surface charge of the SLNs, as observed via zeta potential measurements. The role of SDS was found to be dual: while contributing to nanoparticle stabilization, higher SDS concentrations diminished overall protein corona formation, as indicated by reduced protein content measurements. Complementary in silico analysis supported these findings by elucidating potential binding interactions between proteins and the nanoparticle surface. Contingent on the purpose of the protein corona, surfactants can be used to either promote or reduce the presence of the protein corona. Tying into the findings of other studies, protein corona formation does occur on this particularly synthesized lipid nanoparticle and does affect drug release. Although the protein corona initially attenuated premature drug leakage, it ultimately altered the overall release profile. Future work should focus on proteomic characterization of the adsorbed corona components to gain mechanistic insights into their biological roles. This would provide a foundation for advancing targeted drug delivery strategies through deliberate manipulation of protein-nanoparticle interactions.