
What this is
- are organelles involved in energy metabolism and redox homeostasis.
- This research investigates how influences biogenesis.
- Using yeast and human fibroblasts, the study reveals that stress triggers proliferation through specific signaling pathways.
Essence
- increases numbers via de novo biogenesis and fission, regulated by the heat shock response and TOR inhibition. This mechanism is crucial for cellular recovery from stress.
Key takeaways
- , such as that induced by tunicamycin, leads to increased numbers. This occurs through enhanced de novo biogenesis and some division of existing .
- The heat shock response (HSR) activation and TOR signaling inhibition are critical for mediating proliferation during . This suggests a conserved mechanism across species.
- biogenesis is essential for cell survival under stress conditions, indicating their role in cellular adaptation and potential implications for treating biogenesis disorders.
Caveats
- The study primarily uses yeast models, which may limit the direct applicability of findings to human systems. Further research is needed to validate these mechanisms in human cells.
- While the study identifies key pathways involved in proliferation, the exact molecular interactions and regulatory networks require further investigation.
Definitions
- peroxisome: An organelle involved in lipid metabolism and detoxification, crucial for maintaining cellular homeostasis.
- proteotoxic stress: Cellular stress caused by the accumulation of misfolded or damaged proteins, leading to disrupted cellular functions.
Simplified
Introduction
Peroxisomes are essential, evolutionarily conserved organelles that play key roles in energy metabolism via fatty acid oxidation and redox homeostasis1. Their biogenesis is controlled by PEX genes, many of which are conserved across species, and their turnover occurs by selective autophagy, known as pexophagy2. Peroxisome biogenesis occurs either by growth and division of pre-existing peroxisomes, or by de novo biogenesis, which involves the budding and subsequent fusion of pre-peroxisomal vesicles from the endoplasmic reticulum (ER)2,3. The balance between peroxisome biogenesis and turnover maintains its homeostasis, which is sensitive to nutritional cues. This is exemplified in single-celled yeasts by the induction of peroxisomes in cells grown in oleate because fatty acid oxidation is exclusively peroxisomal4. In rodents, a diverse class of compounds called peroxisome proliferators transcriptionally induce genes encoding fatty acid metabolizing enzymes, coincident with peroxisome proliferation5; however, the regulation of human peroxisomes remains unclear6. Not surprisingly, significant efforts have focused on the intracellular signaling pathways responding to nutritional cues resulting in peroxisome induction4,7,8. However, peroxisomes also respond to environmental stresses, but the studies investigating the signaling components and mechanisms involved are limited in both number and scope9–11. The importance of peroxisomes arises not only from their metabolic specialization, but also from their roles in immunometabolism, development, aging, and human disease12–15, including human peroxisome biogenesis disorders (PBDs). This is the driving imperative to understand peroxisome biogenesis and its modulation, particularly its role in the adaptation to varying forms of abiotic environmental conditions, such as heat10,16, light17, pH, salt11, redox18,19, and organelle stress9, which necessitate a coordinated cellular response, often requiring contributions from several sub-cellular compartments and membrane contact sites2,20–22.
Here, we demonstrate that proteotoxic ER stress induced by tunicamycin treatment causes peroxisome proliferation in Saccharomyces cerevisiae, Komagataella phaffii, and primary human fibroblasts. By manipulating the many arms of the ER stress response either genetically or pharmacologically, we discern that proteotoxic ER stress increases peroxisome number partially by activating the heat shock response (HSR) in the cytosol and by inhibiting TOR1. Mechanistically, this is executed via increased peroxisome production mainly through the de novo mode along with some fission of pre-existing peroxisomes, instead of impaired pexophagy. Importantly, peroxisome biogenesis is necessary for cell survival in response to tunicamycin treatment. Our study thus sheds light on the role of de novo peroxisome biogenesis in cellular adaptation to ER stress, with emphasis on evolutionary conservation of this adaptation, the role of multiple sub-cellular compartments in coordinating the response, as well as the types of stress and signaling pathways that activate this proliferation response. Overall, this study paves the path for a better understanding of peroxisome biogenesis in response to environmental insults, while also presenting potential applications in the management of PBDs.
Results
Inactivation of Kar2/BiP triggers UPR and causes peroxisome proliferation
Kar2, the yeast homolog of mammalian BiP, belongs to the Hsp70 family of chaperone proteins residing in the ER lumen. During protein misfolding stress in the ER lumen, Kar2 binds to unfolded proteins thereby dissociating from its binding partner, Ire124. Inactivation of Kar2 induces the unfolded protein response (UPR, monitored by induction of UPRE-GFP) (Supplementary Fig. 1a, b), as well as the cytosolic heat shock response (HSR, monitored by induction of HSE-GFP) (Supplementary Fig. 1c, d), when compared to WT cells at 37 °C24. To understand how loss of Kar2 function is connected to peroxisome homeostasis, we investigated the effects of UPR and HSR activation on peroxisome proliferation.
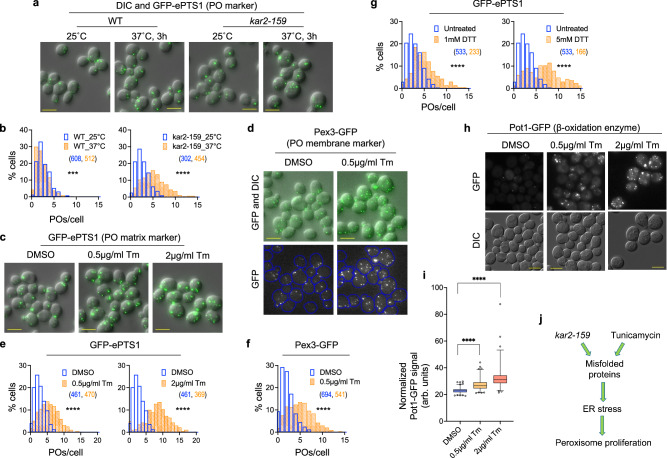
![Protein misfolding stress induces peroxisome proliferation. Z-projection images showing peroxisomes marked by GFP-ePTS1 in WT andcells grown at 25 °C and at 3 h after transfer to 37 °C.Histograms showing population distribution of the number of peroxisomes per cell (POs/cell) in WT andmutant cells at 25 °C and after 3 h of growth at 37 °C [Median POs/cell at 25 °C: WT: 2,: 2; Median POs/cell at 37 °C: WT: 2,: 5; number of cells (N) indicated in parentheses; two-tailed Mann–Whitney test: *** < 0.001; **** < 0.0001].–Z-projection images (,) and histograms (,) showing the number of peroxisomes at 5 h after treatment with DMSO or tunicamycin (Tm, 0.5 µg/mL or 2.0 µg/mL as shown). Peroxisomes were visualized using either a peroxisomal matrix marker, GFP-ePTS1 (,), or a peroxisomal membrane protein, Pex3-GFP (,) [Nindicated in parentheses; two-tailed Mann–Whitney test: **** < 0.0001].Histograms showing peroxisomes per cell at 5 h after treatment with 1 mM or 5 mM DTT [Nindicated in parentheses; two-tailed Mann–Whitney test: **** < 0.0001].,Single Z-slice images () and quantification () showing Pot1-GFP (peroxisomal thiolase) levels per cell after treatment with tunicamycin [N: DMSO: 510, 0.5 µg/ml Tm: 454, 2 µg/ml Tm: 340; bounds of the box: interquartile range (IQR), center line: median, whiskers: 1–99 percentile, points: top and bottom 1 percentile; two-tailed Mann–Whitney test: **** < 0.0001].Schematic depicting that cells experiencing ER stress, which could be caused either by loss of Kar2 function or treatment with tunicamycin, manifest peroxisome proliferation phenotypes, such as increased organelle number and increased level of peroxisomal enzymes. In this and subsequent figures, the number of cells for each histogram is indicated in parentheses and depicted in matching font color as the histograms. Scale bar in all images: 5 µm. a b c f c d e f c e d f g h i h i j kar2-159 kar2-159 kar2-159 kar2-159 P P P P P cells cells cells cells](https://europepmc.org/articles/PMC12663454/bin/41467_2025_65776_Fig1_HTML.jpg "Click to view full size")
Protein misfolding stress induces peroxisome proliferation. Z-projection images showing peroxisomes marked by GFP-ePTS1 in WT andcells grown at 25 °C and at 3 h after transfer to 37 °C.Histograms showing population distribution of the number of peroxisomes per cell (POs/cell) in WT andmutant cells at 25 °C and after 3 h of growth at 37 °C [Median POs/cell at 25 °C: WT: 2,: 2; Median POs/cell at 37 °C: WT: 2,: 5; number of cells (N) indicated in parentheses; two-tailed Mann–Whitney test: *** < 0.001; **** < 0.0001].–Z-projection images (,) and histograms (,) showing the number of peroxisomes at 5 h after treatment with DMSO or tunicamycin (Tm, 0.5 µg/mL or 2.0 µg/mL as shown). Peroxisomes were visualized using either a peroxisomal matrix marker, GFP-ePTS1 (,), or a peroxisomal membrane protein, Pex3-GFP (,) [Nindicated in parentheses; two-tailed Mann–Whitney test: **** < 0.0001].Histograms showing peroxisomes per cell at 5 h after treatment with 1 mM or 5 mM DTT [Nindicated in parentheses; two-tailed Mann–Whitney test: **** < 0.0001].,Single Z-slice images () and quantification () showing Pot1-GFP (peroxisomal thiolase) levels per cell after treatment with tunicamycin [N: DMSO: 510, 0.5 µg/ml Tm: 454, 2 µg/ml Tm: 340; bounds of the box: interquartile range (IQR), center line: median, whiskers: 1–99 percentile, points: top and bottom 1 percentile; two-tailed Mann–Whitney test: **** < 0.0001].Schematic depicting that cells experiencing ER stress, which could be caused either by loss of Kar2 function or treatment with tunicamycin, manifest peroxisome proliferation phenotypes, such as increased organelle number and increased level of peroxisomal enzymes. In this and subsequent figures, the number of cells for each histogram is indicated in parentheses and depicted in matching font color as the histograms. Scale bar in all images: 5 µm. a b c f c d e f c e d f g h i h i j kar2-159 kar2-159 kar2-159 kar2-159 P P P P P cells cells cells cells
Induction of proteotoxic ER stress causes peroxisome proliferation and upregulates peroxisomal 3-ketoacyl-CoA thiolase
After confirming the induction of UPRE-GFP by tunicamycin (Supplementary Fig. 1e, f) (Tm), a nucleoside antibiotic that interferes with N-glycosylation of proteins in the ER lumen, we tested its effect on peroxisome number by counting Pex3-GFP and GFP-ePTS1 puncta. Pex3 is a peroxisomal membrane protein (PMP), whereas GFP-ePTS1 is imported into the peroxisome lumen. Tunicamycin (non-lethal doses, Supplementary Fig. 1i) significantly increased the number of peroxisomes as visualized by both markers (Fig. 1c–f), as well as the cumulative area occupied by all peroxisomes per cell (Supplementary Fig. 1j, k), within 2–5 h of treatment (Supplementary Fig. 1n). We also verified that all GFP-ePTS1 and Pex3-GFP puncta represent bona fide peroxisomes in both DMSO and tunicamycin-treatment conditions (Supplementary Fig. 1l, m), and that ER stress induced by non-lethal doses of DTT also increased peroxisome number (Fig. 1g and Supplementary Fig. 1i). We confirmed a recent report, which suggested that peroxisome numbers (monitored indirectly by total Pex11-mNeonGreen fluorescence)9 increase as an adaptation to supply additional acetyl-CoA via peroxisomal β-oxidation to support mitochondrial respiration during ER stress. To directly explore this idea, we examined whether ER stress induced peroxisomal β-oxidation enzymes, which are repressed during growth in glucose. Endogenous levels of GFP-tagged 3-ketoacyl-CoA thiolase (Pot1)8, which catalyzes the final step in peroxisomal β-oxidation, increased following tunicamycin treatment (Fig. 1h, i). Collectively, our observations indicate that ER stress resulting from misfolded proteins, caused either by loss of Kar2 function or by tunicamycin, results in peroxisome proliferation (Fig. 1j and Supplementary Fig. 1).
![ER stress-induced peroxisome proliferation occurs independent of the UPR and ERSU pathways. –Histograms showing tunicamycin-induced peroxisome proliferation in the UPR pathway mutants, such as∆,∆ and∆, relative to WT cells [Nindicated in parentheses; two-tailed Mann–Whitney test: **** < 0.0001].,Histogram of number of peroxisomes per cell () and box plot for normalized Pot1-GFP levels () at 5 h after treatment with phytosphingosine (PHS) or tunicamycin [Median POs/cell: DMSO: 2, 20 µM PHS: 3 for (); N: DMSO: 327, 0.5 µg/ml Tm: 264, 2 µg/ml Tm: 227, 20 µM PHS: 228 for (); for (Nindicated in parentheses; two-tailed Mann–Whitney test: **** < 0.0001; for (bounds of the box: IQR, center line: median, whiskers: 1–99 percentile, points: top and bottom 1 percentile; two-tailed Mann–Whitney test: ****< 0.0001].Flowchart showing the potential signaling routes that induce peroxisome proliferation during stress. The green arrows show the routes which we experimentally verified to be operational for signaling, whereas the clear arrows show the path which we verified to either not be required, viz. UPR, or not be sufficient, viz PHS treatment, to induce peroxisome proliferation. a c d e d e d e d) e) f ire1 hac1 gcn4 P P P cells cells cells](https://europepmc.org/articles/PMC12663454/bin/41467_2025_65776_Fig2_HTML.jpg "Click to view full size")
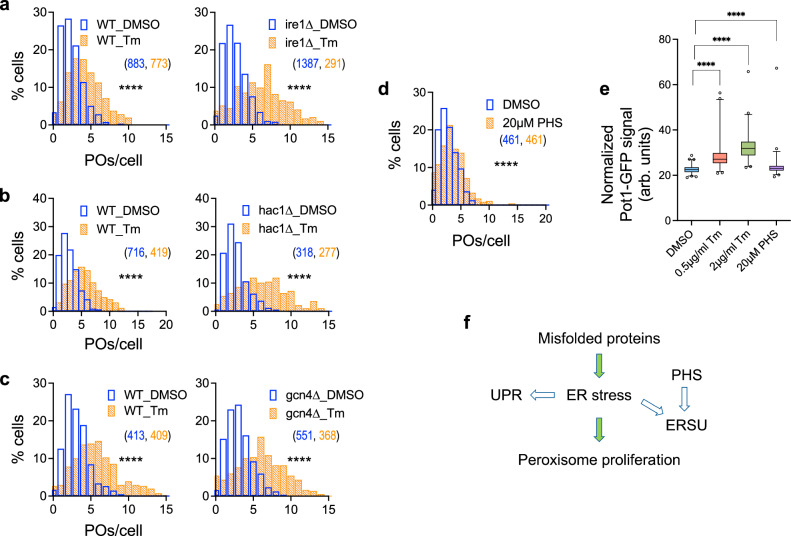
ER stress-induced peroxisome proliferation occurs independent of the UPR and ERSU pathways. –Histograms showing tunicamycin-induced peroxisome proliferation in the UPR pathway mutants, such as∆,∆ and∆, relative to WT cells [Nindicated in parentheses; two-tailed Mann–Whitney test: **** < 0.0001].,Histogram of number of peroxisomes per cell () and box plot for normalized Pot1-GFP levels () at 5 h after treatment with phytosphingosine (PHS) or tunicamycin [Median POs/cell: DMSO: 2, 20 µM PHS: 3 for (); N: DMSO: 327, 0.5 µg/ml Tm: 264, 2 µg/ml Tm: 227, 20 µM PHS: 228 for (); for (Nindicated in parentheses; two-tailed Mann–Whitney test: **** < 0.0001; for (bounds of the box: IQR, center line: median, whiskers: 1–99 percentile, points: top and bottom 1 percentile; two-tailed Mann–Whitney test: ****< 0.0001].Flowchart showing the potential signaling routes that induce peroxisome proliferation during stress. The green arrows show the routes which we experimentally verified to be operational for signaling, whereas the clear arrows show the path which we verified to either not be required, viz. UPR, or not be sufficient, viz PHS treatment, to induce peroxisome proliferation. a c d e d e d e d) e) f ire1 hac1 gcn4 P P P cells cells cells
Misfolded protein stress causes peroxisome proliferation partially via heat shock response activation
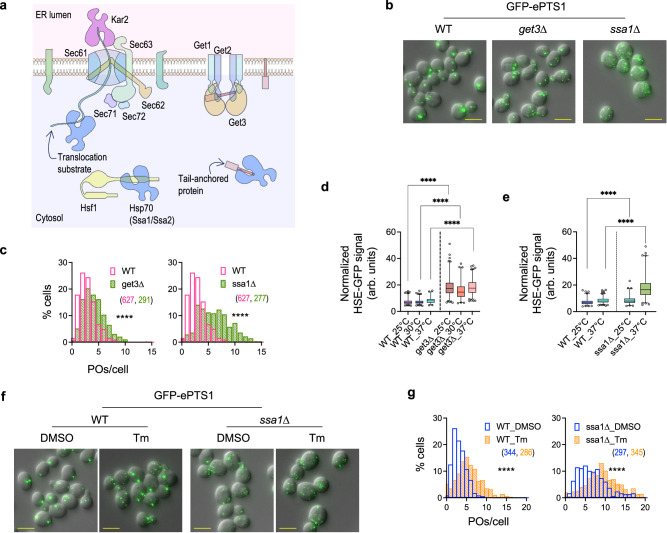
Analogous to the UPR in the ER, the heat shock response pathway is activated in response to the presence of misfolded and aggregated proteins in the cytosol. Signaling through this pathway is primarily mediated by Hsf1, which binds to the Heat Shock Elements (HSEs) in gene promoters and activates transcription of chaperones and components of the Ubiquitin-proteasome system (UPS) involved in protein degradation33. We induced the heat shock response pathway by deleting SSA1, which encodes the Hsp70 chaperone that binds and represses Hsf134. Under non-stress conditions, Ssa1 and its paralog Ssa2 maintain Hsf1 in an inactive state; however, during stress, unfolded or misfolded proteins titrate the Hsp70s away from Hsf1, thereby allowing transcriptional activation at HSEs. The ssa1∆ cells exhibited not only elevated HSE-GFP levels (Fig. 3e and Supplementary Fig. 3b), but also a marked increase in peroxisome number compared to WT (Fig. 3b, c). The median number of peroxisomes in ssa1∆ was 7–8, versus 3 in WT, with ~70% of ssa1∆ cells containing >5 peroxisomes, compared to ~5% in WT. Loss of Ssa1 caused an increase in the number of peroxisomes, comparable to that of tunicamycin-treated wild-type cells (Fig. 3f, g). Surprisingly, tunicamycin further increased the number of peroxisomes in ssa1∆ cells, with the median rising to 9–12 after tunicamycin treatment, compared to 6-7 in DMSO-treated cells (Fig. 3f, g). These results suggest that tunicamycin and Hsf1 activation may act synergistically in stimulating peroxisome proliferation.
![Peroxisome proliferation during ER stress is partially driven via HSR activation. Cartoon showing molecular players involved in the crosstalk between protein homeostasis in the ER and cytosol. Proteins destined for the ER are translocated across the ER membrane or inserted via the Sec61 or Get pathways. Kar2 on the luminal side and Hsp70s including Ssa1 in the cytoplasm prevent the translocation substrates from misfolding. Hsp70s also keep tail-anchored proteins from misfolding in the cytoplasm before their transfer to Get3 for membrane insertion. Hsp70s additionally are bound to Hsf1 and keep it inactive; however, increased burden of unfolded proteins in the cytoplasm can titrate Hsp70 away from Hsf1, thereby activating the latter. Protein translocation defects inat 37 °C, or in∆ can potentially cause the buildup of ER proteins in the cytoplasm, thereby activating the heat shock response.,Z-projection images () and histograms () showing the number of peroxisomes per cell in WT,∆ and∆ [for (), Nindicated in parentheses; two-tailed Mann–Whitney test: ****< 0.0001].,Induction of HSR visualized using HSE-GFP levels per cell in∆ at 25 °C or at 3 h after transfer to 30 °C or 37 °C () or∆ at 25 °C or at 3 h after transfer to 37 °C () [Nfor WT: 25 °C: 504, 30 °C: 540, 37 °C: 270; Nfor∆: 25 °C: 579, 30 °C: 316, 37 °C: 537;Nfor WT: 25 °C: 416, 37 °C: 620; Nfor∆: 25 °C: 344, 37 °C: 491);,bounds of the box: IQR, center line: median, whiskers: 1–99 percentile, points: top and bottom 1 percentile; two-tailed Mann–Whitney test: **** < 0.0001].,Z-projection images () and histograms () showing the number of peroxisomes per cell in∆ compared to WT after treatment with DMSO or 0.5 µg/ml tunicamycin for 5 h [Nindicated in parentheses; two-tailed Mann–Whitney test: **** < 0.0001]. Scale bar in all images: 5 µm. a b c b c c d e d e d e d e f g f g g kar2-159 get3 get3 ssa1 P get3 ssa1 get3 ssa1 P ssa1 P cells cells cells cells cells cells](https://europepmc.org/articles/PMC12663454/bin/41467_2025_65776_Fig3_HTML.jpg "Click to view full size")
Peroxisome proliferation during ER stress is partially driven via HSR activation. Cartoon showing molecular players involved in the crosstalk between protein homeostasis in the ER and cytosol. Proteins destined for the ER are translocated across the ER membrane or inserted via the Sec61 or Get pathways. Kar2 on the luminal side and Hsp70s including Ssa1 in the cytoplasm prevent the translocation substrates from misfolding. Hsp70s also keep tail-anchored proteins from misfolding in the cytoplasm before their transfer to Get3 for membrane insertion. Hsp70s additionally are bound to Hsf1 and keep it inactive; however, increased burden of unfolded proteins in the cytoplasm can titrate Hsp70 away from Hsf1, thereby activating the latter. Protein translocation defects inat 37 °C, or in∆ can potentially cause the buildup of ER proteins in the cytoplasm, thereby activating the heat shock response.,Z-projection images () and histograms () showing the number of peroxisomes per cell in WT,∆ and∆ [for (), Nindicated in parentheses; two-tailed Mann–Whitney test: ****< 0.0001].,Induction of HSR visualized using HSE-GFP levels per cell in∆ at 25 °C or at 3 h after transfer to 30 °C or 37 °C () or∆ at 25 °C or at 3 h after transfer to 37 °C () [Nfor WT: 25 °C: 504, 30 °C: 540, 37 °C: 270; Nfor∆: 25 °C: 579, 30 °C: 316, 37 °C: 537;Nfor WT: 25 °C: 416, 37 °C: 620; Nfor∆: 25 °C: 344, 37 °C: 491);,bounds of the box: IQR, center line: median, whiskers: 1–99 percentile, points: top and bottom 1 percentile; two-tailed Mann–Whitney test: **** < 0.0001].,Z-projection images () and histograms () showing the number of peroxisomes per cell in∆ compared to WT after treatment with DMSO or 0.5 µg/ml tunicamycin for 5 h [Nindicated in parentheses; two-tailed Mann–Whitney test: **** < 0.0001]. Scale bar in all images: 5 µm. a b c b c c d e d e d e d e f g f g g kar2-159 get3 get3 ssa1 P get3 ssa1 get3 ssa1 P ssa1 P cells cells cells cells cells cells
![Peroxisome proliferation in response to misfolded protein stress occurs despite individual inactivation of Snf1, Hog1, and Rtg pathways. Flowchart showing the pathways that get activated or inhibited in response to ER stress.–Histograms showing the number of peroxisomes per cell after 5 h treatment with tunicamycin or DMSO in mutants blocked in signaling through various pathways implicated in peroxisome biogenesis. The effect of blocking the RTG pathway on peroxisome number () was examined using deletion mutants of the pathway's transcriptional activators, Rtg1 and Rtg3, as well as their upstream regulator, Rtg2. The necessity of SNF1 pathway for peroxisome proliferation upon tunicamycin treatment was tested using∆ (), whereas the requirement of the HOG pathway was tested using∆ () and a double deletion mutant of the pathway's transcriptional activators, Msn2 and Msn4 (). WT in () same as Fig. . The role of Mig1 and Mig2, transcriptional repressors of peroxisome biogenesis genes, in tunicamycin-driven peroxisome proliferation was tested using their respective deletion mutants ().Constitutive activation of Protein Kinase A (PKA) by overexpressing Tpk1 (TPK1oe) was carried out using a multicopy plasmid containing theORF expressed from its endogenous promoter [–Nindicated in parentheses; two-tailed Mann–Whitney test: **** < 0.0001].Heatmap of GLM analysis showing the mutants with reduced response to tunicamycin in purple and those with increased response in orange, compared to WT. The zero count and positive count columns show response coefficients from their respective components of the hurdle model used to fit the mutant's peroxisomal count data [**** indicates FDR-adjustedvalues (Benjamini–Hochberg method) <0.0001 from likelihood ratio tests]. a b e b c c d d e f b f g snf1 hog1 TPK1 P P 2a cells](https://europepmc.org/articles/PMC12663454/bin/41467_2025_65776_Fig4_HTML.jpg "Click to view full size")
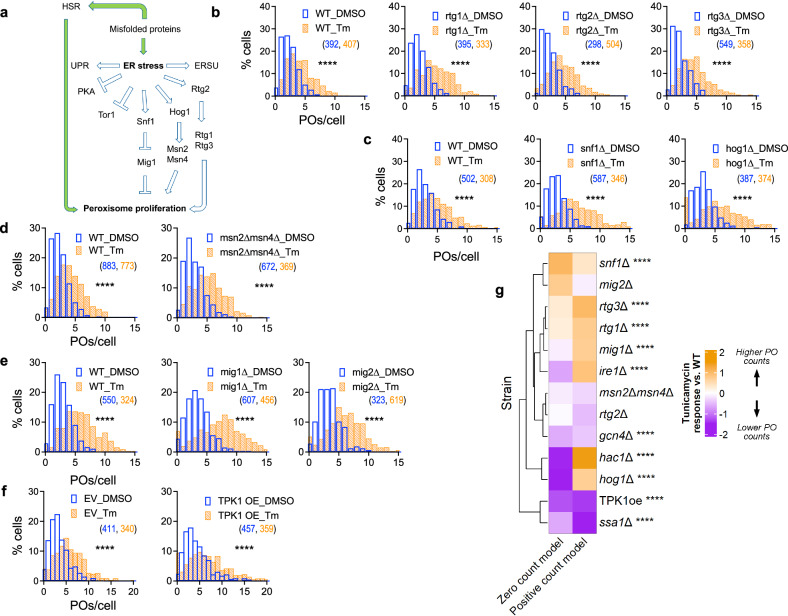
Peroxisome proliferation in response to misfolded protein stress occurs despite individual inactivation of Snf1, Hog1, and Rtg pathways. Flowchart showing the pathways that get activated or inhibited in response to ER stress.–Histograms showing the number of peroxisomes per cell after 5 h treatment with tunicamycin or DMSO in mutants blocked in signaling through various pathways implicated in peroxisome biogenesis. The effect of blocking the RTG pathway on peroxisome number () was examined using deletion mutants of the pathway's transcriptional activators, Rtg1 and Rtg3, as well as their upstream regulator, Rtg2. The necessity of SNF1 pathway for peroxisome proliferation upon tunicamycin treatment was tested using∆ (), whereas the requirement of the HOG pathway was tested using∆ () and a double deletion mutant of the pathway's transcriptional activators, Msn2 and Msn4 (). WT in () same as Fig. . The role of Mig1 and Mig2, transcriptional repressors of peroxisome biogenesis genes, in tunicamycin-driven peroxisome proliferation was tested using their respective deletion mutants ().Constitutive activation of Protein Kinase A (PKA) by overexpressing Tpk1 (TPK1oe) was carried out using a multicopy plasmid containing theORF expressed from its endogenous promoter [–Nindicated in parentheses; two-tailed Mann–Whitney test: **** < 0.0001].Heatmap of GLM analysis showing the mutants with reduced response to tunicamycin in purple and those with increased response in orange, compared to WT. The zero count and positive count columns show response coefficients from their respective components of the hurdle model used to fit the mutant's peroxisomal count data [**** indicates FDR-adjustedvalues (Benjamini–Hochberg method) <0.0001 from likelihood ratio tests]. a b e b c c d d e f b f g snf1 hog1 TPK1 P P 2a cells
Peroxisome proliferation in response to ER stress is partially mediated by TOR1 inactivation
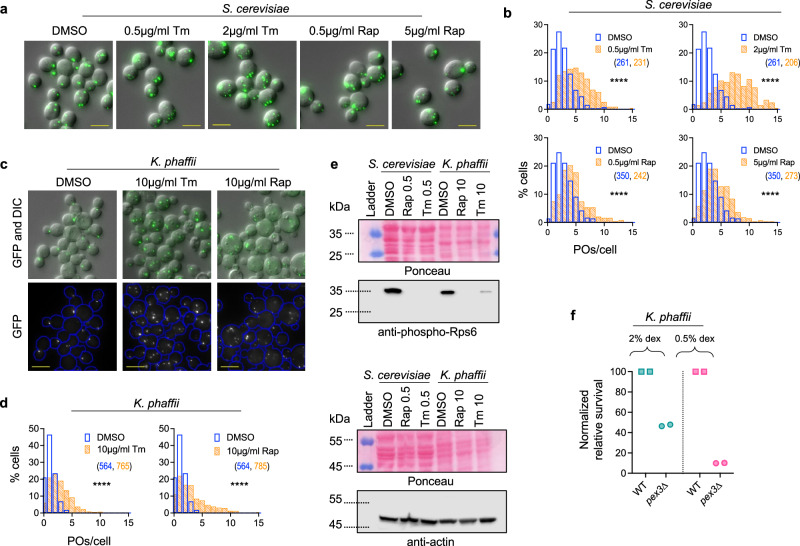
The adaptive response to ER stress occurs via activation of SNF1-, HOG- and RTG-signaling pathways and inactivation of TOR1 and PKA27,36–40; however, among these, the specific pathways that mediate the signaling response to trigger peroxisome proliferation in response to tunicamycin remain unclear (Fig. 4a). We systematically abrogated signaling through each pathway and investigated the effect of tunicamycin on peroxisome proliferation in mutants compared to WT using our GLM analysis (Fig. 4). Given published findings on the involvement of these pathways in yeast peroxisome proliferation and regulation of PEX gene expression, we were surprised to discover that blocking the retrograde signaling (RTG) (Fig. 4b, g)9,11, SNF14,8,41 (Fig. 4c, g), or HOG pathways7 (Fig. 4c, g) did not significantly impair peroxisome proliferation upon tunicamycin treatment. Similarly, the loss of both Msn2 and Msn4 (Fig. 4d, g), which mediate the transcriptional response upon activation of the HOG pathway, as well as the heat shock response pathway7, also did not prevent tunicamycin-induced peroxisome proliferation. Furthermore, we also found that cells lacking Mig1, the peroxisome biogenesis repressor that gets phosphorylated and subsequently inactivated by active Snf1, or Mig2, which shares overlapping functions with Mig142–44, showed a comparable number of peroxisomes to WT, after both DMSO as well as tunicamycin treatments (Fig. 4e, g). Consistent with our findings that peroxisome proliferation in ER stress is independent of Snf1, we observed that Snf1 was not activated after tunicamycin treatment under our assay conditions; however, Hog1 was activated after 4 h (Supplementary Fig. 4).
Response to ER stress also involves the inhibition of PKA45 and TOR138 (Supplementary Fig. 4). We tested the role of PKA by using a strain overexpressing TPK1 (TPK1oe) using a multicopy plasmid46, which constitutively activates PKA, relative to a control strain carrying an empty vector. Our GLM analysis indicated that the relative increase in peroxisome number in response to tunicamycin treatment was reduced in TPK1oe cells compared to that in cells carrying the empty vector (Fig. 4f, g). This result suggests that high levels of PKA activity attenuate the tunicamycin-induced peroxisome proliferation.
We tested the significance of peroxisomes in adaptation to ER stress by measuring the survival of WT and pex3∆ cells in rich media containing 2% or 0.5% dextrose (where respiration is more prevalent) after overnight (~14 h) treatment with a low dose of 0.5 µg/ml tunicamycin followed by a high dose of 20 µg/ml tunicamycin for 6 h (Fig. 5f and Supplementary Fig. 5b). Corroborating similar findings in S. cerevisiae9, K. phaffii cells lacking Pex3, which is essential for peroxisome biogenesis2, consistently showed <50% survival in the tunicamycin-viability assay, which was reduced to <10% under reduced glucose availability compared to WT cells, underscoring the significance of peroxisome biogenesis in the adaptation.
Peroxisome contribution to cellular adaptation during ER stress was analyzed by comparing the survival of human primary fibroblasts derived from a Zellweger Spectrum Disorder patient carrying homozygous PEX16 R176* mutations (hereafter referred to as pex16KO) to WT47. Fibroblasts were first pretreated for 12 h with primary doses of tunicamycin (range 0 to 20 µg/ml), then challenged with a secondary tunicamycin treatment (20 µg/ml) or DMSO for 12 h and then assayed for viability. The sensitivity to primary tunicamycin treatment alone was more blunted in pex16KO cells compared to WT (Fig. 6c, "DMSO" panel), possibly the result of higher metabolic activity in the latter. When primary treatment was followed with secondary tunicamycin challenge, the prior exposure to tunicamycin conferred a protective effect against subsequent stress in both cell lines, but this benefit was diminished in pex16KO cells (Fig. 6c, "Tm" panel). A GLM analysis of this data revealed a significant interaction between genotype, primary tunicamycin dose, and secondary tunicamycin challenge (likelihood ratio test P value = 0.004), indicating that prior exposure to tunicamycin confers a greater adaptation to secondary challenge in WT versus pex16KO cells. These findings suggest that peroxisome biogenesis supports adaptive resilience during ER stress, although the residual benefit observed in pex16KO cells suggests the possibility of additional compensatory pathways.
![Misfolded protein stress causes peroxisome proliferation in yeast via inactivation of Tor1. ,Z-projection images () and histograms () showing the number of peroxisomes per cell inafter Tor1 inactivation by treatment with 0.5 µg/ml or 5 µg/ml rapamycin treatment. Treatments with DMSO and tunicamycin (0.5 µg/ml and 2 µg/ml) performed for comparison [Nindicated in parentheses; two-tailed Mann–Whitney test: **** < 0.0001].,Z-projection images () and histograms () showing the number of peroxisomes per cell in the methylotrophic yeast,, after treatments with 10 µg/ml rapamycin or 10 µg/ml tunicamycin for 5 h [For (d), Nindicated in parentheses; two-tailed Mann–Whitney test: **** < 0.0001].Western blot to examine TOR1 inactivation by testing for Rps6 phosphorylation after treatment ofandcells with DMSO, rapamycin or tunicamycin for 4 h. Ponceau and Actin used as loading and sample processing controls, respectively. The numbers next to the drug names in the labels denote the concentration (µg/ml) of the respective drug used for the treatment. ( = 1 for Rap, = 3 for Tm; uncropped blots shown in Source Data, replicates shown in Supplementary Data ).Quantification of survival of WT and∆cells after overnight treatment with 0.5 µg/ml tunicamycin, followed by treatment with 20 µg/ml tunicamycin for 6 h. Control treatments were performed with DMSO, and colony counts obtained for tunicamycin treatments were divided by those for DMSO treatments to obtain relative survival. Relative survival was normalized with WT to obtain the normalized relative survival for∆. Data from two independent experiments are shown ( = 2). Scale bar in all images: 5 µm. a b a b b c d c d e f S. cerevisiae P K. phaffii P S. cerevisiae K. phaffii n n pex3 K. phaffii pex3 n cells cells 2](https://europepmc.org/articles/PMC12663454/bin/41467_2025_65776_Fig5_HTML.jpg "Click to view full size")
Misfolded protein stress causes peroxisome proliferation in yeast via inactivation of Tor1. ,Z-projection images () and histograms () showing the number of peroxisomes per cell inafter Tor1 inactivation by treatment with 0.5 µg/ml or 5 µg/ml rapamycin treatment. Treatments with DMSO and tunicamycin (0.5 µg/ml and 2 µg/ml) performed for comparison [Nindicated in parentheses; two-tailed Mann–Whitney test: **** < 0.0001].,Z-projection images () and histograms () showing the number of peroxisomes per cell in the methylotrophic yeast,, after treatments with 10 µg/ml rapamycin or 10 µg/ml tunicamycin for 5 h [For (d), Nindicated in parentheses; two-tailed Mann–Whitney test: **** < 0.0001].Western blot to examine TOR1 inactivation by testing for Rps6 phosphorylation after treatment ofandcells with DMSO, rapamycin or tunicamycin for 4 h. Ponceau and Actin used as loading and sample processing controls, respectively. The numbers next to the drug names in the labels denote the concentration (µg/ml) of the respective drug used for the treatment. ( = 1 for Rap, = 3 for Tm; uncropped blots shown in Source Data, replicates shown in Supplementary Data ).Quantification of survival of WT and∆cells after overnight treatment with 0.5 µg/ml tunicamycin, followed by treatment with 20 µg/ml tunicamycin for 6 h. Control treatments were performed with DMSO, and colony counts obtained for tunicamycin treatments were divided by those for DMSO treatments to obtain relative survival. Relative survival was normalized with WT to obtain the normalized relative survival for∆. Data from two independent experiments are shown ( = 2). Scale bar in all images: 5 µm. a b a b b c d c d e f S. cerevisiae P K. phaffii P S. cerevisiae K. phaffii n n pex3 K. phaffii pex3 n cells cells 2
![Proteotoxic stress and TOR inactivation cause peroxisome proliferation in primary human fibroblasts. Z-projection images showing peroxisome proliferation in primary human fibroblasts after treatment with DMSO, 1.11 µM 4-PBA, 1.11 µg/ml tunicamycin, 0.111 µM rapamycin. Nuclei (blue), peroxisomes (green) and actin (magenta) visualized using DAPI, PMP70-AF488 and Phalloidin-AF750 staining, respectively. Scale bar: 50 µm.Numerical density of peroxisomes per µmof cell volume was computed for 5–8 fields of view after independent treatments with either DMSO or the indicated drugs ( = 3). Quantification from each field of view is represented by either a circle, triangle or square; each shape represents an independent treatment [For each condition, the mean and standard error of the combined pool of replicates is shown in the plot: DMSO: 0.018 ± 0.0008; 4-PBA: 0.027 ± 0.0011; Tm: 0.024 ± 0.0014; Rap: 0.023 ± 0.00092; two-tailed Nestedtest: 4-PBA vs DMSO: = 0.0037; df = 4; Tm vs DMSO:= 0.0261, df = 4; Rap vs DMSO: = 0.0223, df = 4; * < 0.05; ** < 0.01].Quantification of viability assayed by CellTiter-Blue fluorescence assay in WT andhuman fibroblasts after a primary, 12 h-long treatment with a range of tunicamycin concentrations, followed by a secondary challenge treatment with 20 µg/ml tunicamycin or DMSO for 12 h. Primary treatments performed with: 0 ng/ml, 80 ng/ml, 155 ng/ml, 310 ng/ml, 625 ng/ml, 1.2 µg/ml, 2.5 µg/ml, 5.0 µg/ml, 10 µg/ml, and 20 µg/ml tunicamycin. Points show mean viability values across at least 24 replicates at the 12 h post-challenge timepoint that were corrected to remove spatial artifacts on experimental plates using a GLM model ("Methods"). Lines are trendlines fit to these points. a b c 3 n t P P P P P pex16KO](https://europepmc.org/articles/PMC12663454/bin/41467_2025_65776_Fig6_HTML.jpg "Click to view full size")
Proteotoxic stress and TOR inactivation cause peroxisome proliferation in primary human fibroblasts. Z-projection images showing peroxisome proliferation in primary human fibroblasts after treatment with DMSO, 1.11 µM 4-PBA, 1.11 µg/ml tunicamycin, 0.111 µM rapamycin. Nuclei (blue), peroxisomes (green) and actin (magenta) visualized using DAPI, PMP70-AF488 and Phalloidin-AF750 staining, respectively. Scale bar: 50 µm.Numerical density of peroxisomes per µmof cell volume was computed for 5–8 fields of view after independent treatments with either DMSO or the indicated drugs ( = 3). Quantification from each field of view is represented by either a circle, triangle or square; each shape represents an independent treatment [For each condition, the mean and standard error of the combined pool of replicates is shown in the plot: DMSO: 0.018 ± 0.0008; 4-PBA: 0.027 ± 0.0011; Tm: 0.024 ± 0.0014; Rap: 0.023 ± 0.00092; two-tailed Nestedtest: 4-PBA vs DMSO: = 0.0037; df = 4; Tm vs DMSO:= 0.0261, df = 4; Rap vs DMSO: = 0.0223, df = 4; * < 0.05; ** < 0.01].Quantification of viability assayed by CellTiter-Blue fluorescence assay in WT andhuman fibroblasts after a primary, 12 h-long treatment with a range of tunicamycin concentrations, followed by a secondary challenge treatment with 20 µg/ml tunicamycin or DMSO for 12 h. Primary treatments performed with: 0 ng/ml, 80 ng/ml, 155 ng/ml, 310 ng/ml, 625 ng/ml, 1.2 µg/ml, 2.5 µg/ml, 5.0 µg/ml, 10 µg/ml, and 20 µg/ml tunicamycin. Points show mean viability values across at least 24 replicates at the 12 h post-challenge timepoint that were corrected to remove spatial artifacts on experimental plates using a GLM model ("Methods"). Lines are trendlines fit to these points. a b c 3 n t P P P P P pex16KO
ER-stress-driven peroxisome proliferation occurs by de novo biogenesis as well as growth and division
We next tested whether the increase in peroxisome number during ER stress depended on peroxisome division or on their de novo synthesis. Vps1 is the primary mediator of peroxisome fission in cells grown in the presence of glucose49, and its deletion resulted in only a partial reduction in tunicamycin-driven peroxisome proliferation compared to WT cells (Fig. 7d, e). We also quantified this tunicamycin response in dnm1∆ single and vps1∆ dnm1∆ double mutants. While the loss of DNM1 alone had an insignificant effect, the absence of both DNM1 and VPS1 significantly, but still only partially, impaired peroxisome proliferation after tunicamycin treatment (Fig. 7d, e), suggesting additional peroxisome formation occurs by the de novo pathway. In DMSO-treated cells, the median number of peroxisomes was 1 in both vps1∆ and vps1∆ dnm1∆ mutants, while tunicamycin-treated cells had a median number of 2 peroxisomes per cell. This suggests that tunicamycin treatment led to the de novo formation of at least one additional peroxisome. In comparison, WT cells had a median number of 3 peroxisomes in DMSO treatment, and 4.5 peroxisomes after tunicamycin treatment. Thus, of the ~1.5 additional peroxisomes formed in WT in response to tunicamycin, at least one could be attributed to de novo biogenesis. Overall, our results demonstrate that de novo biogenesis accounts for approximately two-thirds of the peroxisome formation in response to ER stress.
Further evidence supporting the role of de novo biogenesis in increased peroxisome production during ER stress comes from analyzing the proportion of cells containing peroxisomes in the inheritance mutants inp2∆ and inp1∆ (Fig. 7f, g). In the absence of Inp2, most daughter cells fail to inherit peroxisomes from mother cells and therefore rely exclusively on de novo biogenesis to produce their first peroxisome50,51. Conversely, most mother cells fail to retain peroxisomes in the absence of Inp152, resulting in the total transfer of peroxisomes to their daughter cells. We observed ~45% of inp2∆ cells lacked peroxisomes under DMSO-treated conditions; however, tunicamycin treatment reduced this proportion to ~22% (Fig. 7g), strongly suggesting that ER stress stimulated de novo biogenesis. Corroborating this observation, we found ~25% of inp1∆ cells lacked peroxisomes after tunicamycin treatment, compared to ~40% under DMSO treatment conditions (Fig. 7g). Since de novo peroxisome biogenesis in S. cerevisiae is slow, requiring ~4–5 h50,53, and our analyses were performed within this same timeframe, most of the new peroxisomes observed in response to ER stress are likely due to de novo biogenesis, with the remaining, comprising about one-third, likely derived from the growth and division.
![Increased peroxisome number during ER stress occurs by growth and division as well as de novo biogenesis. Cartoon showing that the peroxisome number in cells is regulated by a balance between pathways that increase peroxisomes, such as growth and division, de novo biogenesis from the ER and acquisition of peroxisomes due to inheritance, and those that reduce peroxisomes, such as pexophagy or transmission to daughter cells during cell division. Histograms showing the number of peroxisomes per cell in () WT or the pexophagy mutant,∆, after treatment with DMSO or 0.5 µg/ml tunicamycin for 5 h, () the autophagy mutant,∆, in comparison to WT (Median number of peroxisomes: WT: 2,∆: 2) and () after 5 h treatment with DMSO or tunicamycin in peroxisome division mutants,∆,∆ and∆∆ compared to WT [–Nindicated in parentheses; two-tailed Mann–Whitney test; comparison considered significantly different if < 0.05; ** < 0.01; **** < 0.0001; for WTvs∆in (), = 0.0322; for WT vs∆ in (),= 0.0017].GLM analyses for the comparison of relative effects of tunicamycin treatment on the number of peroxisomes in mutants versus WT [Likelihood ratio test; FDR-adjusted P values using Benjamini–Hochberg method: **** < 0.0001].Cartoon illustrating peroxisome inheritance defects in∆ and∆ mutants.Quantification of proportion of cells without peroxisomes in the inheritance mutants 5 h after two independent treatments with DMSO or 0.5 µg/mL tunicamycin ( = 2). a b–d b c d b d b c e f g atg36 atg1 atg1 vps1 dnm1 vps1 dnm1 P P P atg36 P atg1 P P inp1 inp2 n cells DMSO DMSO](https://europepmc.org/articles/PMC12663454/bin/41467_2025_65776_Fig7_HTML.jpg "Click to view full size")
Increased peroxisome number during ER stress occurs by growth and division as well as de novo biogenesis. Cartoon showing that the peroxisome number in cells is regulated by a balance between pathways that increase peroxisomes, such as growth and division, de novo biogenesis from the ER and acquisition of peroxisomes due to inheritance, and those that reduce peroxisomes, such as pexophagy or transmission to daughter cells during cell division. Histograms showing the number of peroxisomes per cell in () WT or the pexophagy mutant,∆, after treatment with DMSO or 0.5 µg/ml tunicamycin for 5 h, () the autophagy mutant,∆, in comparison to WT (Median number of peroxisomes: WT: 2,∆: 2) and () after 5 h treatment with DMSO or tunicamycin in peroxisome division mutants,∆,∆ and∆∆ compared to WT [–Nindicated in parentheses; two-tailed Mann–Whitney test; comparison considered significantly different if < 0.05; ** < 0.01; **** < 0.0001; for WTvs∆in (), = 0.0322; for WT vs∆ in (),= 0.0017].GLM analyses for the comparison of relative effects of tunicamycin treatment on the number of peroxisomes in mutants versus WT [Likelihood ratio test; FDR-adjusted P values using Benjamini–Hochberg method: **** < 0.0001].Cartoon illustrating peroxisome inheritance defects in∆ and∆ mutants.Quantification of proportion of cells without peroxisomes in the inheritance mutants 5 h after two independent treatments with DMSO or 0.5 µg/mL tunicamycin ( = 2). a b–d b c d b d b c e f g atg36 atg1 atg1 vps1 dnm1 vps1 dnm1 P P P atg36 P atg1 P P inp1 inp2 n cells DMSO DMSO
Impact of lipid homeostasis on the regulation on peroxisome proliferation during ER stress
Lipid droplets play important roles in energy metabolism and lipid homeostasis by serving as lipid storage sites in cells. Moreover, not only are lipid droplets and peroxisomes generated from a common site in the ER membrane, but the two organelles also maintain crosstalk through contact sites2. Furthermore, ER stress stimulates lipid droplet formation56, as well as microlipophagy57, and one possibility is that lipid droplets could serve as the source of fatty acids for β-oxidation by peroxisomes. We examined how peroxisome proliferation in response to ER stress is coordinated with lipid droplet homeostasis. We found that upon impairing lipid droplet formation by using the quadruple deletion (∆QD) strain, are1∆ are2∆ lro1∆ dga1∆58, peroxisome number was comparable to WT (Fig. 8d, e). The absence of lipid droplets also did not abrogate the tunicamycin-driven increase in peroxisome number (Figs. 4g and 8e) indicating peroxisome proliferation occurs independent of lipid droplet biogenesis.
![Effects of lipid homeostasis impairments on peroxisome proliferation. ,Histogram of peroxisomes per cell () and box plot showing normalized Pot1-GFP levels () in WT cells grown in SD media versus in the absence of inositol [Median number of peroxisomes: SD: 3, SD-Ino: 3; Nindicated in parentheses; two-tailed Mann–Whitney test; comparison considered significantly different if < 0.05; 0.0617;N: SD: 523, SD-Ino: 405].Pathway for PE to PC conversion (top) and histograms (bottom) showing the number of peroxisomes per cell in mutants impaired in PC synthesis,∆ and∆. WT same as Fig. [Median POs/cell: WT: 2,∆: 3,∆:5; Nindicated in parentheses; two-tailed Mann–Whitney test: **** < 0.0001].Single Z-slice images showing peroxisomes (GFP-ePTS1) and the localization of Erg6-mcherry, the lipid droplet marker, in WT and a quadruple mutant (∆QD,∆∆∆∆) impaired in lipid droplet formation. Scale bar: 5 µm.Histograms showing the number of peroxisomes per cell in WT and ∆QD mutant, after treatment with DMSO or 0.5 µg/ml tunicamycin for 5 h [Nindicated in parentheses; two-tailed Mann–Whitney test: **** < 0.0001]. GLM analysis indicated that the QD mutant's response to Tm was not significantly different than WT (Likelihood ratio testvalue = 0.5039).Flowchart showing that the accumulation of misfolded proteins can lead to peroxisome proliferation via multiple routes including inactivation of TOR1 and PKA pathways, or activation of heat shock response (HSR). While proteotoxic ER stress also leads to activation of UPR-, SNF1-, HOG-, RTG and ERSU-, peroxisome proliferation under these conditions occurs independent of these pathways. In addition, among the pathways causing lipid bilayer stress, PC deficiency also leads to peroxisome proliferation, probably via HSR activation. a b a b b c d e f cells cells cells cells P cho2 opi3 cho2 opi3 P are1 are2 lro1 dga1 P P 7c](https://europepmc.org/articles/PMC12663454/bin/41467_2025_65776_Fig8_HTML.jpg "Click to view full size")
Effects of lipid homeostasis impairments on peroxisome proliferation. ,Histogram of peroxisomes per cell () and box plot showing normalized Pot1-GFP levels () in WT cells grown in SD media versus in the absence of inositol [Median number of peroxisomes: SD: 3, SD-Ino: 3; Nindicated in parentheses; two-tailed Mann–Whitney test; comparison considered significantly different if < 0.05; 0.0617;N: SD: 523, SD-Ino: 405].Pathway for PE to PC conversion (top) and histograms (bottom) showing the number of peroxisomes per cell in mutants impaired in PC synthesis,∆ and∆. WT same as Fig. [Median POs/cell: WT: 2,∆: 3,∆:5; Nindicated in parentheses; two-tailed Mann–Whitney test: **** < 0.0001].Single Z-slice images showing peroxisomes (GFP-ePTS1) and the localization of Erg6-mcherry, the lipid droplet marker, in WT and a quadruple mutant (∆QD,∆∆∆∆) impaired in lipid droplet formation. Scale bar: 5 µm.Histograms showing the number of peroxisomes per cell in WT and ∆QD mutant, after treatment with DMSO or 0.5 µg/ml tunicamycin for 5 h [Nindicated in parentheses; two-tailed Mann–Whitney test: **** < 0.0001]. GLM analysis indicated that the QD mutant's response to Tm was not significantly different than WT (Likelihood ratio testvalue = 0.5039).Flowchart showing that the accumulation of misfolded proteins can lead to peroxisome proliferation via multiple routes including inactivation of TOR1 and PKA pathways, or activation of heat shock response (HSR). While proteotoxic ER stress also leads to activation of UPR-, SNF1-, HOG-, RTG and ERSU-, peroxisome proliferation under these conditions occurs independent of these pathways. In addition, among the pathways causing lipid bilayer stress, PC deficiency also leads to peroxisome proliferation, probably via HSR activation. a b a b b c d e f cells cells cells cells P cho2 opi3 cho2 opi3 P are1 are2 lro1 dga1 P P 7c
Discussion
While peroxisome induction in response to nutritional cues is well studied, fewer studies have examined the effects of environmental stress on peroxisomes, especially at the mechanistic level9–11. Our study reveals that ER stress induces peroxisome proliferation in S. cerevisiae, as well as in K. phaffii and human fibroblasts, which represent 250 M and 1 billion years of divergence from S. cerevisiae, respectively59.
Peroxisomes have been considered to be dispensable for growth in glucose since yeast mutants impaired in peroxisome biogenesis are viable and do not exhibit major growth defects. Moreover, enzymes for fatty acid β-oxidation are typically repressed in cells metabolizing glucose. However, our study demonstrates that even during growth in glucose media, upon onset of ER stress, peroxisomes become crucial for survival and the expression of a key β-oxidation enzyme, Pot1, is induced. Additionally, induction of other peroxisomal enzymes required for redox balance, carbon metabolism and amino acid biosynthesis, has also been reported60. Thus, ER stress not only induces peroxisomes, but reprograms them for cellular adaptation.
The onset of ER stress triggers several signaling pathways to enable survival via adaptive mechanisms, including peroxisome proliferation (Fig. 8f). Among these, the activation of UPR or ER stress surveillance pathways is not involved in inducing peroxisome proliferation. Instead, our results point to the mistargeting of ER proteins, as seen in get3Δ cells, and/or the subsequent accumulation of misfolded proteins in the cytosol, as observed in ssa1Δ cells, as primary triggers of peroxisome proliferation. Our findings reveal a mechanism linking protein quality control and cytosolic proteotoxic stress to peroxisome biogenesis. Although the RTG pathway has been previously shown to increase peroxisome numbers during salt stress and Pex11-GFP levels after tunicamycin treatment, and the HOG pathway regulates fatty acid metabolism during salt stress and oleate metabolism, our data reveal that both pathways are dispensable for peroxisome proliferation during ER stress. The Snf1 pathway and its downstream effectors, such as Adr1, Oaf1, and Cat8, regulate peroxisome biogenesis and induction of β-oxidation enzymes in yeast metabolizing oleate20,25. However, several lines of evidence indicated that ER-stress-driven peroxisome proliferation is independent of Snf1. Firstly, contrary to a previous report39, we did not observe Snf1 activation even after 4 h of tunicamycin treatment under our assay conditions. Moreover, loss of Snf1 did not prevent peroxisome proliferation after tunicamycin addition. Furthermore, loss of Mig1, the transcriptional repressor, which is inactivated upon Snf1 activation, or Mig2, the transcriptional repressor with overlapping targets as Mig1 but under the control of Snf3, did not mimic tunicamycin-driven peroxisome proliferation or further increase the effects of tunicamycin on peroxisome number.
Our study has also identified the role of TOR, HSR and PKA pathways in the regulation of stress-induced peroxisomes. Our data indicate that rapamycin treatment and thereby TOR inactivation, either partially in S. cerevisiae and mammalian cells, or considerably in K. phaffii, mimics the effects of tunicamycin on peroxisomes. This agrees with a previous report of TOR inhibition during ER stress, as corroborated also by our study. ER stress also inhibits PKA, and our data show that PKA activation using TPK1 overexpression partially impairs tunicamycin-driven induction of peroxisomes. Notably, Hsf1 activation can inhibit TOR signaling61 and overexpression of Hsf1 can activate transcriptional targets of Oaf1, Pip2, and Msn2/462. Hsf1 in turn has been shown to be under negative control of PKA63. However, the interplay between Tor1 and PKA pathways is more complex with the two kinases depicting mutually positive, as well as negative, interactions64.
Among the two pathways of peroxisome formation, yeast cells metabolizing glucose primarily synthesize new peroxisomes by growth and division. However, upon transition to growth in oleate, peroxisomes undergo proliferation with dynamin Dnm1 playing an important role in peroxisome fission. Consistent with this, our data indicate that stress-induced peroxisome proliferation is partially impaired in cells lacking Vps1, but is independent of Dnm1, suggesting a mechanism distinct from growth in oleate. Furthermore, by comparing the extent of ER-stress-driven peroxisome proliferation in mutants blocked in peroxisome division (vps1∆ and vps1∆ dnm1∆) versus WT, we estimate that de novo biogenesis accounts for roughly two-thirds of peroxisome biogenesis in response to ER stress, with growth and division playing a supportive role. Additional evidence for tunicamycin-induced de novo peroxisome formation comes from inp1Δ and inp2Δ cells, which have peroxisomes only in daughter and mother cells51, and new peroxisomes in mother and daughter cells in these respective mutants can only have arisen de novo65. In contrast, salt-induced stress in yeast induces peroxisome by upregulating division of the organelle11.
Our study also demonstrates that while peroxisome proliferation may be intimately tied to lipid homeostasis, impairing lipid balance by blocking lipid droplet formation did not alter the number of peroxisomes in untreated cells or block peroxisome proliferation after tunicamycin treatment. Lipid stress or UPR activation using inositol deprivation also does not cause peroxisome proliferation. Notably, while abrogation of PC synthesis, using cho2∆ or opi3∆ mutants, does cause peroxisome proliferation, its effects could be via HSR activation. Moreover, PC deficiency also leads to the destabilization and degradation of certain ER proteins, including Sbh1, the β-subunit of the Sec61 translocon66, suggesting that its effects on peroxisome proliferation could be driven via impaired translocation of membrane proteins as seen in get3∆ cells.
Overall, this study extends the influence of the ER and the cytosol on peroxisome homeostasis, further emphasizing the interconnectivity and coordination between compartments in mounting an appropriate response to stress and maintaining cellular homeostasis. While ER stress induces peroxisome proliferation, peroxisomal import stress also induces the ER stress response and the integrated stress response (ISR) pathway in flies and human cells67. These data and the results presented here establish the framework of an important, conserved, feedback loop between ER and peroxisome stress. In addition, our study may inform pharmacological interventions that can induce peroxisomes in human cells which will be exciting to pursue further in developing therapeutics for PBDs.
Methods
Strains and plasmids
Yeast strains were generated using lithium acetate-PEG-mediated transformation and are listed in Supplementary Data 1. Strains expressing PTDH3-GFP-ePTS1-TPGK1 (i.e., GFP-ePTS1), 4×UPRE-PCYC1-GFP-TACT1 (i.e., UPRE-GFP) or 4×HSE-PCYC1-GFP-TACT1 (i.e., HSE-GFP) were generated by transforming linear constructs obtained by double digesting the plasmids pNS31, pNS32 or pLT1, respectively, with PciI and NotI. All three constructs were targeted after the STOP codon of the UBC9 ORF. Except where noted, parental knock-out strains were obtained from the MATα deletion library (Invitrogen)68. SNF1, INP2, and DNM1 genes were knocked out by transforming the corresponding deletion constructs, which in turn, were generated by fusing hphMX6 or Zeo cassettes on either side with ~600-1000 bp sequences upstream and downstream of the respective ORFs. Appropriate replacement of these ORFs by the selection marker was confirmed by primers shown in Supplementary Data 2. 4×UPRE-PCYC1-GFP-TACT1 was amplified from pRH120969. For generating strains overexpressing TPK1 (TPK1oe), plasmid pPHY205646 was transformed in yeast; the corresponding control strain was made by transforming the empty vector (EV), pRS426 in yeast.
Yeast growth, treatments, microscopy, and western blotting
Except when noted, S. cerevisiae log phase cells grown in synthetic defined [SD; 6.7 g/L Yeast nitrogen base (YNB without amino acids, BD/Difco; 291920) + 0.79 g CSM (Sunrise Science Products; 1001-100) + 2% dextrose] at 30 °C and shaken at 250 RPM were used. For experiments with HSE-GFP and kar2-159, cultures were grown at 25 °C and 250 RPM. RTG pathway mutants are glutamate auxotrophs, and hence those mutants and their corresponding WT were grown in SD + 0.02% glutamic acid. Cultures were resuspended in fresh media at an OD ~0.05–0.1 prior to performing temperature shifts (to 30 °C or 37 °C for 3 h as indicated in figure legends) or treatments with tunicamycin (Sigma, T7765; 1 mg/ml stock in DMSO) or rapamycin (Sigma, R0395; 1 mg/ml stock in DMSO) or phytosphingosine (Sigma, Cas No. 554-62-1; 10 mM stock in DMSO) or DMSO or DTT (Roche, 10708984001; 1 M stock in H2O). TPK1 overexpression experiments were performed in SD-Ura media to maintain selection for the plasmids. For all the experiments with K. phaffii, cell growth and treatments were done in YPD media (10 g/L Yeast extract + 20 g/L Bactopeptone + 2% Dextrose). SD-Ino media was prepared using YNB without inositol (US Biological Life Sciences; Y2030-01). The effect of tunicamycin on cell viability was measured by quantifying the percentage of cells stained by propidium iodide (PI). For this, yeast cultures were treated with 4 µg/ml PI (Sigma, P4170; 1 mg/ml stock in DMSO) for 20 min at room temperature, followed by 1× wash and resuspension in media for subsequent imaging.
Cells were imaged using a Zeiss Plan Apochromat 63×/1.4 Oil DIC objective mounted on an Axioskop 2 mot plus microscope (Zeiss) equipped with Axio Cam HRm camera and HBO 100 mercury lamp. For 3D imaging to count the number of peroxisomes per cell, Z stacks consisting of 8 slices (for S. cerevisiae) or 6 slices (for K. phaffii) were acquired with a Z spacing of 1 µm. For UPRE-GFP, HSE-GFP, Pot1-GFP and PI staining only a single slice at the focal plane was imaged. Exposure times were kept identical across all experiments for each fluorescent marker, whereas DIC images were acquired with auto exposure.
Western blotting was performed from cell extracts generated after TCA-precipitation using the following antibodies: Phospho-S6 Ribosomal Protein (Ser235/236) (D57.2.2E) XP Rabbit mAb, Cell Signaling Technology (#4858, 1:2000); Phospho-AMPKα (Thr172) (40H9) Rabbit mAb, Cell Signaling Technology (#2535, 1:2000); Phospho-p38 MAPK (Thr180/Tyr182) (D3F9) XP Rabbit mAb, Cell Signaling Technology (#4511, 1:2000); Phospho-PKA Substrate (RRXS*/T*) (100G7E) Rabbit mAb, Cell Signaling Technology (#9624, 1:2000); Anti-ScActin Rabbit pAb20, Gift from Michael Yaffe (1:5000); Goat Anti-Rabbit IgG (H + L)-HRP Conjugate, Bio-RAD; (#1721019, 1:5000).
Human fibroblast cell culture and microscopy
Human primary fibroblasts were cultured at 37 °C with 5% CO₂ in high-glucose Dulbecco's Modified Eagle Medium (DMEM; high glucose with sodium bicarbonate and non-essential amino acids; Gibco) supplemented with 15% (v/v) heat-inactivated fetal bovine serum (FBS; VWR). Primary human fibroblasts were purchased from Coriell Institute (Cat. No. GM06231 and GM00969). All experiments were conducted using fibroblasts with fewer than ten passages. For imaging, fibroblasts were seeded in glass-bottom 96-well plates (Cellvis) and treated with the indicated concentrations of tunicamycin (Sigma), rapamycin (Sigma), or 4-phenyl butyric acid (4-PBA) (Sigma). After a 12 h incubation, cells were fixed with formaldehyde and stained with NucBlue Stain mixed with ProLong Glass Antifade Mountant (Thermo Fisher Scientific, P36985), PMP70-AF488 [anti-PMP70 antibody, Abcam (EPR5614; 1:1000); donkey anti-Rabbit IgG (H + L)-Alexa Fluor 488, Thermo Fisher Scientific (A-21206, 1:2000)], and Phalloidin-AF750 (Thermo Fisher Scientific, A30105, 165 nM working conc.). Each treatment condition included three biological replicates. For imaging, 6–8 3D confocal z-stacks per well were acquired using a Zeiss 980 confocal microscope equipped with a 63×/1.2 NA water immersion objective lens and NIR detector. Each z-stack had dimensions of 4096 × 4096 × 31 voxels, corresponding to a physical volume of approximately 210 × 210 × 6 µm³.
Image processing and quantitative analysis of human fibroblasts
To quantify peroxisome abundance in individual human fibroblasts, we developed a custom 3D image processing pipeline implemented in Python (Clarifi3D), optimized for high-resolution confocal z-stacks and using NVIDIA A100 GPUs on the Seattle Children's Research Institute High-Performance Compute Cluster, Sasquatch. Raw images (4096 × 4096 × 31 voxels; 0.0509 × 0.0509 × 0.2 µm voxel size) were loaded and preprocessed using GPU-accelerated normalization and filtering routines. Cell and nucleus segmentation were performed using pre-trained 3D U-Net models applied to the phalloidin and DAPI channels, respectively, followed by seed-based Delaunay watershed segmentation. Peroxisomes were segmented from PMP70-AF488 images using a classical spot detection pipeline comprising 3D Laplacian-of-Gaussian morphological filtering, global Otsu thresholding, and seeded 3D Delaunay watershed segmentation. For each field-of-view, the numerical peroxisome density was calculated as the number of segmented peroxisomes divided by the total cytoplasmic volume of fully segmented cells. Results from six to eight stacks per well were averaged across three biological replicates per condition.
Viability assay in human fibroblasts
Human primary dermal fibroblasts from a healthy donor (GM00969; wild-type, WT) and a ZSD-patient cell line for PEX16 (GM06231; pex16KO) line were cultured in DMEM (high glucose, with sodium bicarbonate and non-essential amino acids; Gibco) supplemented with 15% FBS. Cells were maintained at 37 °C in a humidified atmosphere containing 5% CO₂. For drug treatments, cells were seeded at 2000 cells per well in black-wall, clear-bottom 384-well plates (Costar) in 40 µL media per well and allowed to adhere overnight. Drug treatments were performed in a randomized matrix format using tunicamycin (dissolved in DMSO) in a 1:2 serial dilution. Tunicamycin was titrated to a top concentration of 20 µg/mL. The viability assay was conducted on two independent 384-well plates, with 12 biological replicates per concentration on each plate. After 12 h of drug exposure, half of the wells received a secondary tunicamycin challenge at 20 µg/mL to induce acute ER stress, while the other half received a DMSO mock treatment. Viability was assessed 12 h later using CellTiter-Blue (Promega) per the manufacturer's instructions. CellTiter-Blue fluorescence was quantified using a Spectromax I3 automated plate imager (Molecular Devices). Raw fluorescence intensity was extracted from each well.
Data analyses, statistics, and reproducibility
Figure images for depicting the number of peroxisomes in cells were made by generating maximum intensity Z projections for the peroxisome channel (GFP) and average intensity Z projection for cell outline (DIC) channel. Figure images for depicting UPRE-GFP, Pot1-GFP, and HSE-GFP were made with single-Z slice images. Identical brightness and contrast settings were applied across all images within a figure panel to ensure fair comparisons, using FIJI/ImageJ software. Scale bars in all figures represent 5 µm, except for the human fibroblasts, where a 50 µm scale bar was used. Quantification for the number of peroxisomes per cell (for GFP-ePTS1 and Pex3-GFP) as well as for the intensity of GFP signal per cell (for Pot1-GFP, UPRE-GFP and HSE-GFP) was performed using the perox-per-cell software23 using a minimum peroxisome area threshold of 1 pixel and the following values for the software's peroxisome detection sensitivity: 0.0064 for GFP-ePTS1, Pot1-GFP, 4xUPRE-GFP, and 4xHSE-GFP; 0.003 for Pex3-GFP. For quantification of Pot1-GFP, UPRE-GFP and HSE-GFP levels, the values for GFP signal intensities for each cell were divided by 10,000× the value of their respective cell areas and to obtain the "normalized GFP signal" used in the plots. GraphPad Prism (version 10.4.0, Boston, Massachusetts) and R (version 4.4.0) were used to generate the graphs.
No statistical method was used to predetermine sample size. Except for experiments involving kar2-159 and hac1∆ (rationale explained below), no data were excluded from the analyses. The experiments were not randomized except for experiments in Fig. 6c, where for the human fibroblasts grown in 384-well plates, drug treatments were performed in a randomized manner. The investigators were not blinded to allocation during experiments and outcome assessment. All yeast experiments were done twice, in separate experimental batches and all numerical data from these repeats organized as batches are available in Supplementary Data 2. A batch consisted of a group of 1–4 mutants that were tested together with a common WT control. Two different batches for a mutant thus represented two independent treatments, each with at least 100 cells. While the graphs in the figures depict data from a single repeat/batch, GLM analyses were performed on data pooled across batches and thus included both repeats, to rule out discrepancies due to batch-specific effects. In the box plots, the bound of the box indicates the interquartile range (IQR), whereas the center line indicates the medians. The whiskers in the box plots represent 1–25 and 75–99 percentiles of the data, whereas the top and bottom 1 percentiles are represented as dots outside these bounds. In the histograms, the X axis was cropped mostly at 15 or sometimes at 20 peroxisomes/cell, since any higher bin values accounted for <1% of the frequencies; however, these higher data points were not excluded from analyses, and all numerical data are included in Source Data/Supplementary Data 2. We observed significant cell death for kar2-159 ts mutant cells at 37 °C, and hac1∆ after tunicamycin treatment, therefore we manually excluded dead cells from the histograms for those experiments. For this, any atypical cell that showed shriveling, the presence of large vacuoles, or obvious damage and abnormal shape as visualized on the DIC channel was marked as dead. Our empirical observations indicated that almost all cells with zero peroxisomes were dead or severely damaged, except in inp1∆ and inp2∆, where the lack of peroxisomes can be attributed to inheritance defects. We also did not exclude dead cells from the data for GLM analyses (see below), hence many of the mutants that appear to have significant changes in zero peroxisome counts are those where we observed more death after tunicamycin treatment (viz. hac1∆, hog1∆). Using GraphPad Prism, after confirming that the data did not fit normal distribution using D'Agostino & Pearson, Anderson–Darling, Shapiro–Wilk, and Kolmogorov–Smirnov tests, we used the Two-tailed Mann–Whitney test and computed a P value for each replicate to evaluate statistical significance between control and treatment groups. An unpaired t test with Welch's correction was used to evaluate statistical significance for comparison of peroxisome area and cumulative peroxisome area per cell (n = 3 experiments). Statistical significance for peroxisomal numerical density in human fibroblasts was evaluated using a nested t test (n = 3 experiments).
Quantitative analyses of tunicamycin-induced peroxisome counts across mutant strains
We used generalized linear modeling (GLM) in R (version 4.4.0) to model the distribution of peroxisome (PO) counts in cells across treatment conditions and strains. Due to the presence of a high number of cells with zero counts in some strains, we modeled distributions with hurdle models35 using the "pscl" R package (version 1.5.9), where zero and non-zero (positive) peroxisome counts are captured using separate functions. A binomial distribution was used to model zero counts, and a negative binomial distribution was used to model non-zero counts. We found that, based on the Akaike Information Criterion, hurdle models fit the data better than zero-inflation and simple negative binomial models.
To compare a mutant strain's tunicamycin response to WT, we first combined that strain's peroxisome count data for both the DMSO and tunicamycin treatment conditions with the full set of WT count data collected across all experiments and strains. This included data from both DMSO- and tunicamycin-treated WT cells. We then used GLM to fit the data using a model formula that included strain, treatment, experimental batch, and an interaction term to quantify strain-specific responses to tunicamycin. 1 \documentclass[12pt]{minimal} \usepackage{amsmath} \usepackage{wasysym} \usepackage{amsfonts} \usepackage{amssymb} \usepackage{amsbsy} \usepackage{mathrsfs} \usepackage{upgreek} \setlength{\oddsidemargin}{-69pt} \begin{document}$${{{\rm{FULL}}}}\; {{{\rm{MODEL}}}}\!\!:{PO\; count} \sim \,{Strain}+{Treatment}+{Batch}+{Strain}\!\!:{Treatment}$$\end{document} FULL MODEL P O c o u n t S t r a i n T r e a t m e n t B a t c h S t r a i n T r e a t m e n t : ~ + + + :
We tested whether the mutant strain's response to tunicamycin was significantly different than WT by performing a likelihood ratio test where GLM results using the following reduced model were compared to those from the full model. 2 \documentclass[12pt]{minimal} \usepackage{amsmath} \usepackage{wasysym} \usepackage{amsfonts} \usepackage{amssymb} \usepackage{amsbsy} \usepackage{mathrsfs} \usepackage{upgreek} \setlength{\oddsidemargin}{-69pt} \begin{document}$${{{\rm{REDUCED\; MODEL}}}}\!\!:{PO\; count} \sim {Strain}+{Treatment}+{Batch}$$\end{document} REDUCED MODEL P O c o u n t S t r a i n T r e a t m e n t B a t c h : ~ + +
P values collected from these tests across strains were then adjusted for the false discovery rate using the Benjamini–Hochberg method70. We considered mutant strains with P values < 0.05 as those with tunicamycin responses that were significantly different from WT.
To determine whether a mutant strain's response to tunicamycin was stronger or weaker compared to WT, we examined the value of the coefficients for the Strain:Treatment interaction term in the mutant strain's full GLM model. Because hurdle models have two modeling components, there are two interaction term coefficients to consider: one from the zero-count model and one from the non-zero count model. For heatmap visualization, the coefficients from a given hurdle modeling component were z-score normalized across the values obtained from all strains (i.e., normalized by column for the heatmaps). For consistency, positive values in these visualizations indicate that the modeling component predicts a stronger tunicamycin response in a mutant strain compared to WT. That is, it predicts a response resulting in higher peroxisome counts. As mentioned earlier, we observed a significantly large proportion of dead cells in hac1∆ and hog1∆ strains following tunicamycin treatment. The zero-count model interaction term coefficients in the GLM analyses on those strains reflected this, resulting in higher predicted zero-count instances. To ensure that the presence of dead cells did not bias our analyses, we made inferences on the relative effects of tunicamycin-induced peroxisome proliferation for mutants vs. WT based only on the interaction term coefficients of the positive-count model.
Quantitative analysis of WT andhuman fibroblast survival to tunicamycin-induced ER stress pex16KO
To quantitatively characterize the contribution of peroxisomes to the adaptive response of human fibroblasts to ER stress, we performed a GLM analysis on the viability assay data from WT and pex16KO human fibroblast cells described above ("Viability assay in human fibroblasts"). Using the CellTiter-Blue fluorescence readout as an indicator of viability, we used R to fit our data using the following formula.3\documentclass[12pt]{minimal} \usepackage{amsmath} \usepackage{wasysym} \usepackage{amsfonts} \usepackage{amssymb} \usepackage{amsbsy} \usepackage{mathrsfs} \usepackage{upgreek} \setlength{\oddsidemargin}{-69pt} \begin{document}$${Viability} \sim \,{Genotype} \, * \,{PrimaryTmConcentration}\, * \,{SecondaryTreatment} +{Row}+{Column}+{Timepoint}$$\end{document}Viability~Genotype*PrimaryTmConcentration*SecondaryTreatment+Row+Column+Timepoint
Here, PrimaryTmConcentration represents the concentration of tunicamycin used to pretreat cells prior to secondary challenge. The SecondaryTreatment term indicates the secondary challenge applied to the cells (DMSO or tunicamycin). The Row and Column terms were included to account for spatial artifacts on experimental plates. Two post-challenge measurements were performed, one at 12 h and one at 12.5 h, and the Timepoint term is included to quantify viability differences between those two timepoints.
To determine whether there was a difference between strains in the way that tunicamycin pretreatment affected viability following secondary challenge, we performed a likelihood ratio test comparing results from the full model formula above to results from a reduced model where the interaction term Genotype:PrimaryTmConcentration:SecondaryTreatment was removed. This is the term in the model that captures how the strains respond to the secondary treatment stress with respect to the primary concentration of tunicamycin they received. The value of this term's coefficient indicates the degree to which primary tunicamycin treatment concentration alters WT cells' viability following secondary tunicamycin challenge compared to pex16KO cells. For scatterplots used to visualize differences in strain responses to secondary challenge, we used our fitted GLM to correct raw experimental fluorescence values for spatial artifacts on experimental plates, then computed the mean values across replicates. All mean values for a specific combination of genotype and secondary treatment were then normalized by subtracting the value observed at a primary tunicamycin concentration of 0 ng/mL. Trendlines in plots were computed using linear regression.
Reporting summary
Further information on research design is available in the linked to this article. Nature Portfolio Reporting Summary
Supplementary information
Supplementary Information Description of Additional Supplementary Files Supplementary Data 1 Supplementary Data 2 Reporting Summary Transparent Peer Review file
Source data
Source Data