
What this is
- This study investigates the effects of glucagon and exenatide:glucagon co-infusion on () and cardiac function in adults with type 2 diabetes (T2D).
- Eight participants underwent three randomized infusion visits with different intravenous treatments.
- Results indicate significant increases in and improvements in diastolic function markers following the co-infusion.
Essence
- Glucagon and exenatide:glucagon co-infusion significantly increased and improved markers of diastolic dysfunction in adults with type 2 diabetes. These findings suggest potential benefits for cardiac function in this population.
Key takeaways
- Co-infusion of exenatide and glucagon increased () from a median of 9.2 × 10µmol/g/min with saline to 20 × 10µmol/g/min. This indicates enhanced cardiac energy metabolism.
- The left ventricular global peak diastolic circumferential strain rate improved significantly from 0.619 1/s with saline to 0.686 1/s with exenatide:glucagon. This reflects better diastolic function.
- The study demonstrated that 88% of participants showed increased with glucagon and exenatide:glucagon co-infusion, which may have implications for managing cardiovascular risk in T2D.
Caveats
- The study's small sample size (n=8) limits the generalizability of the findings. Further research is needed to confirm these results in larger populations.
- The exploratory nature of this pilot study means that conclusions regarding long-term effects and clinical outcomes should be approached with caution.
Definitions
- myocardial glucose uptake (MGU): The rate at which glucose is taken up by the heart muscle, essential for energy production.
- left ventricular (LV) diastolic dysfunction: Impaired relaxation of the heart's left ventricle, often leading to heart failure symptoms.
Simplified
Introduction
The heart has the highest oxygen demand in the human body per unit of weight (4.3 mmol/kg/min)1. Oxidation of substrates is necessary in order for the heart to generate adenosine triphosphate (ATP). In healthy subjects, under normal physiological conditions, the myocardium depends on the aerobic metabolism of glucose (~ 40%) and β-oxidation of fatty acids (~ 60%), which provides the majority of ATP2. The remainder comes from the anaerobic glycolysis of ketone bodies, amino acids and lactate. The choice of substrate metabolism depends on a number of factors including the availability and supply of substrates, oxygen supply and demand, and myocardial workload3. Several metabolic changes occur in the diabetic heart including increased fatty acid oxidation, reduced glucose metabolism and loss of metabolic flexibility4. Myocardial fatty acid uptake increases by 63% in individuals with impaired glucose tolerance, whereas reduced expression and localisation of glucose transporter 4 (GLUT4), the primary mediator of myocardial glucose uptake (MGU) in T2D, contributes to a 22–41% reduction in MGU compared with non-diabetic individuals5–9. The overall shift in substrate metabolism whereby fatty acid oxidation increases and glucose metabolism decreases, despite hyperglycaemia, increases mitochondrial oxygen consumption by around 12% in order to generate the same amount of ATP10. These changes in myocardial bioenergetics contribute to the development of diabetic cardiomyopathy, the primary cause of heart failure in type 2 diabetes (T2D)11. Diabetic cardiomyopathy is a chronic condition characterised by impairments in cardiac structure and function, in the absence of hypertension, ischemia, or coronary artery disease12. Left ventricular (LV) diastolic dysfunction (with a preserved LV ejection fraction) is an early, asymptomatic manifestation of diabetic cardiomyopathy13. This progresses to LV dilatation, myocardial fibrosis, LV hypertrophy, and ultimately, symptomatic heart failure with systolic dysfunction and reduced ejection fraction14. Epidemiological data from The Framingham Heart Study shows that T2D is an independent risk factor for heart failure, even after adjustment for other cardiac risk factors including age, hypertension, dyslipidaemia, obesity and coronary heart disease15.
Dual and multi-agonist synthetic peptides at the GLP-1 and glucagon receptor are currently in clinical development as potential new treatments for T2D and other chronic metabolic conditions including obesity, chronic kidney disease and metabolic dysfunction-associated steatohepatitis16–19. Simultaneous targeting of the GLP-1 and glucagon receptors aims to leverage the beneficial metabolic effects of these receptors to suppress appetite and reduce body weight, whilst simultaneously balancing opposing effects on glucose metabolism20. With regards to synthetic GLP-1 receptor agonists, a number of landmark trials demonstrate a reduction in major adverse cardiovascular events in T2D and obesity21–23. In a meta-analysis of over 60,000 patients, GLP-1 receptor agonists caused a 14% relative risk reduction in major adverse cardiovascular events24. GLP-1 receptor agonists improve markers of cardiac function in patients with T2D25–28, however their effects on heart failure related outcomes are less certain29,30. Data from seven trials indicates that GLP-1 receptor agonists reduce cardiovascular mortality and admissions for heart failure by 9% in T2D31. Semaglutide improves heart failure symptoms and reduce heart failure related events in obese individuals with preserved ejection fraction32. Other data suggests GLP-1 receptor agonists may have a neutral, or even negative effect, on heart failure related outcomes, especially in those with a reduced ejection fraction (< 40%)29,33. By contrast, sodium glucose co-transporter 2 inhibitors (SGLT2i) strongly reduce the risk of hospitalisations for heart failure and cardiovascular death34,35. These data have reignited interest in the relationship between anti-diabetic medications and modulating the risk of heart failure in patients with T2D. Despite ongoing clinical development, limited data exists on the effects of dual GLP-1/glucagon receptor agonism on MGU, cardiac function and myocardial energetics. Our aim was to explore this further using 18F-FDG (18 F-fluorodeoxyglucose) PET-MRI (positron emission tomography magnetic resonance imaging) in overweight patients with T2D.
Methods
Study design
This was a single-centre, single-blinded, physiological, exploratory pilot study. The experimental protocol was approved by South-West-Cornwall and Plymouth Research Ethics Committee (19/SW/0168). The study was registered on Clinicaltrials.gov (NCT04307797) on 13/3/2020 and performed according to the principles of the Declaration of Helsinki.
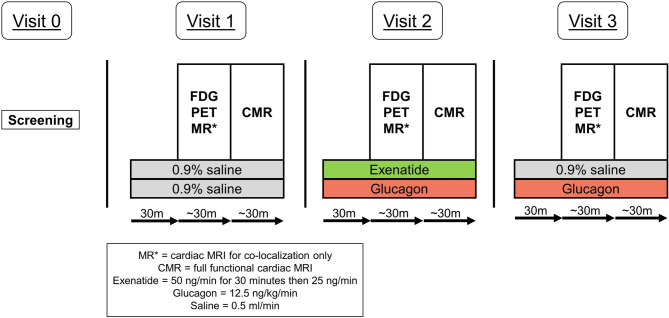
Using a Latin square block design, participants attended three separate imaging visits over a maximum duration of 50 days. Participants received a different intravenous infusion (saline, glucagon or exenatide:glucagon co-infusion) at each visit. Two intravenous cannulae were sited in the upper limbs on the opposite sides – one for the infusion and the other for the 18F-FDG injection and blood sampling. Participants received the first 30 min of the intravenous infusion whilst seated before transfer to the PET-MRI scanner. Two pairs of infusions consisting of combinations of saline (Macopharma, France), glucagon (Novo Nordisk, Crawley, 12.5 ng/kg/min) and exenatide (AstraZeneca, UK, loading dose 50 ng/min for 30 min followed by 25 ng/min) were simultaneously infused through a single cannula, via a double lumen extension set, at either 0.5 ml/min or 1.0 ml/min (Braun Perfusor Space pump, Braun, UK) as per the study schematic diagram in Fig. 1. A low-sorb infusion line (Alaris, P7000 extension set, BD, UK) was used for all infusions. Dose selection was based upon previous similar studies36–45. In order to simulate the effects of GLP-1 and glucagon receptor dual agonism, exenatide (a licensed GLP-1 receptor agonist which shares 53% amino acid homology with native GLP-146) and glucagon were co-infused.

Schematic of study design. Visits 1–3 occurred in a random order as per the randomisation schedule. CMR indicates cardiac MRI; FDG, 18 F-fluorodeoxyglucose; m, minutes; PET, positron emission tomography.
Study population
Non-smoking adults with T2D, an elevated BMI (> 25 kg/m2) and an HbA1 C < 65 mmol/mol attended an initial screening visit for informed written consent. Females of childbearing potential were excluded. Screening included a medical history, physical examination including anthropometric measurements, vital signs, bloods, 12 lead ECG and a transthoracic echocardiogram. Those with severe hypertension, clinically significant heart disease, chronic kidney disease (creatinine > 150 µmol/L), an active malignancy or type 1 diabetes were excluded from the study. Patients prescribed insulin, GLP-1 receptor agonists or dipeptidyl peptidase 4 inhibitors (DPP4i) were also excluded. Local protocols were followed regarding contraindications for PET and MRI scans including pacemakers and implantable cardioverter-defibrillators.
Measurements
PET-MRI scans were conducted in the resting supine position following a six hour overnight fast. Participants were asked to avoid strenuous exercise, alcohol, caffeine and energy drinks for 12 h, and anti-inflammatory drugs including aspirin and ibuprofen for 24 h before study visits. Metformin and SGLT2i were withheld on the morning of the study visit. Participants had continuous cardiac monitoring and 30 min ankle BP measurements (Philips Expression MR400, Philips, Netherlands) during the infusion and scan for safety purposes.
Blood samples
Point of care blood glucose samples (Accu-Check glucose monitor, Roche, France) were taken before starting the infusion to ensure blood glucose < 11.1 mmol/L. If blood glucose > 11.1 mmol/L, the study visit was rescheduled. Blood samples for plasma glucose (for calculation of MGU) and point of care blood glucose were collected prior to the 18F-FDG injection (i.e. before the scan) and again, following completion of the PET-MRI scan. Glucose samples were centrifuged at 2000 rpm for two minutes before freezing and overnight storage, due to residual radioactivity in the second glucose sample.
Imaging methods
Scans were performed on a Signa 3 T PET-MRI scanner (GE Healthcare, Chalfont St Giles, UK) in the Wolfson Brain Imaging Centre (University of Cambridge, Cambridge Biomedical Campus, UK). The first subject was scanned on March 4 th 2022, and the final subject was scanned on October 7 th 2022. For the PET examination, an MR-based attenuation correction scan was obtained before radioligand injection. 18F-FDG was administered intravenously, at approximately 2 MBq/kg. Emission data were acquired dynamically over 60 min and reconstructed using VUE Point FXs with 3 iterations and 16 subsets, including all recommended corrections. In cases of excessive patient motion, PET images were reconstructed again with a separate alignment of the attenuation map for each frame following the time at which the motion had occurred. A myocardial region-of-interest was manually delineated on the PET image overlaid on the MRAC image, using both a summation of the early time frames (first five minutes) and the last time frame, enabling a visualization of the myocardial boundaries. The region of interest was typically 5–10 mm thick and placed within the left myocardium. In addition, a region of interest for the blood pool (~ 50–100 voxels) was positioned inside the left ventricle and positioned as far away from the ventricular wall as possible. If excessive motion was detected, regions of interest were dynamically repositioned. The extracted time-activity curves for the myocardium and the blood pool were combined in a Patlak graphical analysis47, enabling estimation of myocardial uptake rate of 18F-FDG (Ki), which were multiplied by the mean plasma glucose measurements to obtain the MGU.
For the cardiac MRI examination, the protocol consisted of CINE b-SSFP in a stack of short axis (SAX), and in three long axes (LAX) acquired in 2-, 3-, and 4-chamber orientation. These were acquired with 8 mm slice thickness, an acquired in-plane resolution of approximately 1.5 mm, retrospectively reconstructed to 30 cardiac phases. Flow across the mitral valve was quantified using phase contrast MRI. Phase contrast MRI was acquired with 8 mm slice thickness, an acquired in-plane resolution of approximately 2.7 mm, a velocity encoding of 150 cm/s, retrospectively reconstructed to 40 cardiac phases. The SAX and LAX was analysed in Circle CVI42, whereas the mitral flow was quantified in Segment cardiac MRI48.
Statistical analysis
Data were analysed using SPSS version 29 (IBM, New York, USA). No formal power calculations were used given the exploratory nature of the study. Sample size was based on similar experimental pilot studies37–39. Imaging data were analysed using Friedman's Test and the Wilcox Signed-Rank Test. The effect size, r, was calculated by dividing the standardised test statistic, z, by the square root of the sample size, r=(z/√8). Point of care glucose was analysed using area under the curve and the Wilcox Signed-Rank Test. Imaging data and point of care glucose are presented as median ± IQR. A P value < 0.05 was deemed significant for all statistical analyses.
Adverse events
Seven adverse events were reported. Three episodes of urinary frequency in one participant were considered unrelated to the study drugs or PET-MRI scan. Three adverse events of facial tingling secondary to the MRI scan were recorded. One, self-resolving, episode of nausea and tiredness was reported following the combination infusion. All adverse events rapidly resolved. There were no serious adverse events.
Results
Eight participants with a mean age of 52 ± 12 years (range 35–73 years) and BMI 31 ± 4 kg/m2 completed the study (Table 1). Data are presented in Figs. 2, 3 and 4; Table 2. Unless stated, all statistical comparisons are with saline and data are presented as median (IQR).

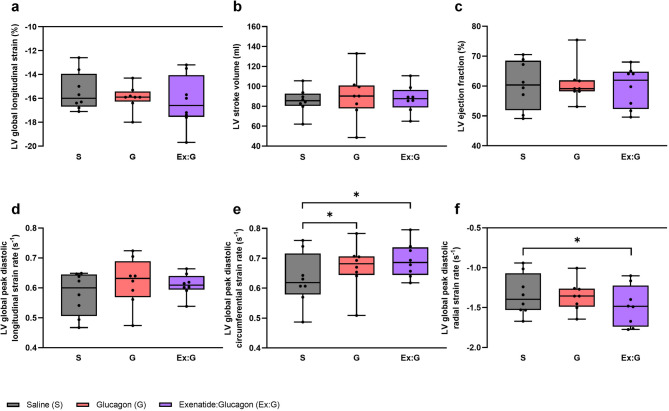
The effect of saline, glucagon and exenatide:glucagon co-infusion on cardiac MRI parameters. a: LV global longitudinal strain. b: LV stroke volume. c: LV ejection fraction. d: LV global peak diastolic longitudinal strain rate. e: LV global peak diastolic circumferential strain rate. f: LV global peak diastolic radial strain rate. Box and whiskers plot with data representing 25 th percentile, median and 75 th percentile. Error bars represent minimum to maximum values. LV indicates left ventricular; S, saline; G, glucagon; Ex: G, exenatide:glucagon combination. * < 0.05. P

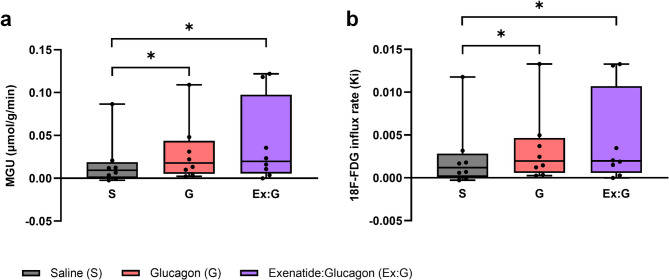
The effect of saline, glucagon and exenatide:glucagon co-infusion on myocardial glucose uptake and theF-FDG influx rate, Ki. a: myocardial glucose uptake. b:F-FDG influx rate, Ki. Box and whiskers plot with data representing 25 th percentile, median and 75 th percentile. Error bars represent minimum to maximum values. S represents saline; G, glucagon; Ex: G, exenatide:glucagon combination. * < 0.05. 18 18 P

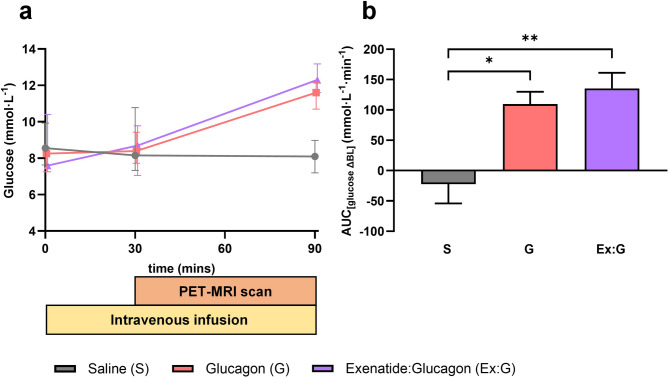
The effect of saline, glucagon and exenatide:glucagon co-infusion on point of care glucose. a: point of care glucose plotted as median ± IQR. b: points of care glucose plotted as change from baseline area under the curve. S represents saline; G, glucagon; Ex: G, exenatide:glucagon combination. * < 0.05, ** < 0.01. P P
| Baseline demographics | |
|---|---|
| Total (male) | 8 (5) |
| Age (years) | 52 ± 12 |
| Age range (years) | 35–73 |
| Height (cm) | 170 ± 11 |
| Weight (kg) | 89 ± 11 |
| BMI (kg/m)2 | 31 ± 4 |
| Body Fat (%) | 33 ± 10 |
| Seated SBP (mmHg) | 140 ± 13 |
| Seated DBP (mmHg) | 79 ± 6 |
| Seated HR (bpm) | 70 ± 7 |
| HbA1 C (mmol/mol) | 53 ± 7 |
| Cardiac MRI data | Saline | Glucagon | Exenatide:glucagon | -valueP |
|---|---|---|---|---|
| LV end systolic volume (ml) | 56 (38–79) | 59 (44–62) | 58 (42–82) | 0.882 |
| LV end diastolic volume (ml) | 142 (123–161) | 142 (126–161) | 152 (127–168) | 0.882 |
| Left atrial minimum volume (ml) | 34 (24–43) | 29 (26–35) | 31 (25–40) | 0.687 |
| Left atrial maximum volume (ml) | 74 (55–82) | 75 (59–83) | 75 (58–84) | 0.882 |
| LV stroke volume (ml) | 86 (80–93) | 90 (78–101) | 88 (79–96) | 0.607 |
| LV mass (g) | 103 (88–118) | 115 (99–121) | 106 (95–124) | 0.093 |
| LV ejection fraction (%) | 60.4 (51.9–68.5) | 59.1 (58.2–61.9) | 62.0 (52.3–64.8) | 0.882 |
| LV GLS (%) | −16.0 (−14.0-[−16.7]) | −15.9 (−15.4-[−16.3]) | −16.6 (−14.1-[−17.6]) | 0.417 |
| LV global peak systolic GLS rate | −0.781 (−0.649-[−0.955]) | −0.842 (−0.684-[−0.967]) | −0.766 (−0.720-[−1.003]) | 0.417 |
| LV global peak diastolic GSL rate | 0.600 (0.506–0.645) | 0.632 (0.569–0.689) | 0.609 (0.594–0.640) | 0.446 |
| LV global radial strain (%) | 33.6 (26.8–38.5) | 31.9 (29.5–38.7) | 33.8 (27.6–40.1) | 0.687 |
| LV global peak systolic radial strain rate | 1.709 (1.470–1.786) | 1.740 (1.382–1.934) | 1.748 (1.461–1.891) | 0.197 |
| LV global peak diastolic radial strain rate | −1.397(−1.070-[−1.531]) | −1.356 (−1.261-[−1.490]) | −1.484 (−1.223-[−1.740]) | *<0.05 |
| LV global circumferential strain (%) | −19.1 (−16.7-[−20.7]) | −18.8 (−17.5-[−21.0]) | −19.3 (−17.1-[−21.3]) | 0.291 |
| LV global peak systolic circumferential strain rate | −0.888 (−0.871-[−0.898]) | −0.924 (−0.843-[−1.001]) | −0.894 (−0.866-[−0.918]) | 0.882 |
| LV global peak diastolic circumferential strain rate | 0.619 (0.580–0.716) | 0.682 (0.644–0.707) | 0.686 (0.644–0.737) | **<0.01 |
| Ratio between early and late filling (mitral flow) | 1.1 (0.87–1.4) | 1.1 (0.98–1.3) | 1.2 (1.2–1.6) | 0.325 |
| Deceleration time (ms) | 229 (197–249) | 239 (194–258) | 198 (186–239) | 0.687 |
| Left atrial emptying fraction (%) | 52.1 (47.2–60.0) | 56.4 (55.3–58.3) | 55.4 (45.1–58.9) | 0.417 |
Glucagon
Glucagon increased MGU in n = 7/8 (88%) participants from 9.2 × 10⁻³ µmol/g/min (0.33–19 × 10−3 µmol/g/min) with saline, to 18 × 10−3 µmol/g/min (5.1–44 × 10−3 µmol/g/min) with glucagon, n = 8, z = 2.10, r = 0.74, P < 0.05. These differences remained significant following calculation of the 18F-FDG influx rate (Ki) (P < 0.05). Glucagon significantly increased the LV global peak diastolic circumferential strain rate from 0.619 1/s (0.580–0.716 1/s) to 0.682 1/s (0.644–0.707 1/s) n = 8, z = 2.10, r = 0.74, P < 0.05. Stroke volume increased in n = 5/8 (63%) participants. There were no significant differences in stroke volume, LV ejection fraction or LV global longitudinal strain between glucagon and saline. Glucagon infusion significantly increased point of care blood glucose (P < 0.05).
Exenatide:glucagon
Exenatide:glucagon increased MGU in n = 7/8 (88%) participants from 9.2 × 10⁻³ µmol/g/min (0.33–19 × 10−3 µmol/g/min) with saline, to 20 × 10−3 µmol/g/min (5.4–98 × 10−3 µmol/g/min) with exenatide:glucagon, n = 8, z = 2.24, r = 0.79, P < 0.05. These differences remained significant following calculation of the 18F-FDG influx rate (Ki) (P < 0.05). Exenatide:glucagon co-infusion significantly increased the LV global peak diastolic circumferential strain rate from 0.619 1/s (0.580–0.716 1/s) to 0.686 1/s (0.644–0.737 1/s) n = 8, z = 2.37, r = 0.84, P < 0.05. A significant improvement in the LV global peak diastolic radial strain rate from − 1.397 1/s (−1.070-[−1.531] 1/s) to −1.484 1/s (−1.223-[−1.740] 1/s) n = 8, z=−2.38, r=-0.84, P < 0.05 was observed. There were no differences in LV ejection fraction between saline, 60.4%, (51.9–68.5%), and exenatide:glucagon, 62.0% (52.3–64.8%), n = 8, z=−0.84, r=−0.30, P = 0.401. Exenatide:glucagon increased LV global longitudinal contraction in n = 6/8 (75%) participants. Overall, co-infusion increased the longitudinal contraction, as shown by a 0.6% reduction in LV global longitudinal strain from − 16.0% (−14.0-[−16.7]%) to −16.6% (−14.1-[−17.6]%) n = 8, z=−1.54, r=−0.54, P = 0.123. Exenatide:glucagon co-infusion significantly increased point of care blood glucose (P < 0.05). Exploratory analyses revealed no significant correlation between MGU and HbA1 C, BMI or blood pressure for any of the infusions.
Discussion
In this human study of overweight adults with T2D, glucagon and exenatide:glucagon co-infusion significantly increased the 18F-FDG influx rate (Ki) and MGU. Exenatide:glucagon significantly increased the LV global peak diastolic circumferential strain rate and significantly decreased the LV global peak diastolic radial strain rate. Exenatide:glucagon numerically increased the LV longitudinal contraction as shown by a reduction in LV global longitudinal strain. Glucagon and exenatide: glucagon co-infusion was well tolerated with an acceptable safety profile.
In pre-clinical studies, increases in MGU during an acute coronary event preserves cardiac function49. In mice, liraglutide increases myocardial glucose oxidation and alleviates diastolic dysfunction50. GLP-1 treatment in rats increases MGU and glucose utilisation by 64% and 14%, respectively51. Similar increases in MGU are seen under resting conditions in lean adults (BMI < 25 kg/m2) infused with GLP-1 (7–36) amide52. No changes in MGU were observed in obese swine and adults with T2D, highlighting the importance of defective insulin signalling in myocardial insulin resistance and T2D6. In agreement, the majority of studies show native GLP-1 (7–36) amide and synthetic GLP-1 receptor agonists do not increase MGU in humans across a range of chronic conditions (Table 3). As 18F-FDG PET-MRI measures MGU (rather than glucose oxidation), increases in MGU do not necessarily equate to an increase in glucose oxidation53. Experimental studies demonstrate that native GLP-1 (7–36) amide improves cardiac function, in pre-clinical and clinical mechanistic studies of ischaemia and reperfusion injury54–57. In adults with T2D, lowering average glycaemia is associated with improvements in markers of systolic and diastolic function, regardless of anti-diabetic medication58. A meta-analysis of 48 studies shows GLP-1 receptor agonists have a small but beneficial effect on LV ejection fraction (+ 2.6%) in patients with T2D and cardiovascular disease59. Physiologically, insulin secretion is enhanced by GLP-1 receptor agonists and is shown to act as a potent stimulator of cardiac glucose metabolism and glucose oxidation60. A decrease in insulin resistance secondary to GLP-1 receptor agonists may further optimise myocardial metabolism61 and improve cardiac function in patients with T2D53. These data indicate that pharmacological interventions which improve myocardial metabolism by switching free fatty acid to glucose oxidation, may drive beneficial improvements in cardiac energetics, contractile function and ultimately, slow the progression of pathological LV remodelling62. Changes in MGU and cardiac function are likely to reflect both indirect effects (modulation of inflammation and endothelial function63) as well as direct effects on the GLP-1 receptor. Mechanistically, the GLP-1 receptor is widely expressed in the heart and vasculature64–66. Hearts from transplant patients and deceased organ donors express GLP-1 mRNA in all four chambers67. GLP-1 mRNA receptor transcripts are found in the sino-atrial node64 as well as atrial and ventricular cardiomyocytes from normal and ischaemic human hearts68. In a large animal experimental model, the GLP-1 receptor is present in pacemaker cells of the sino-atrial node69.
Systemic infusion of glucagon increases heart rate in healthy volunteers, consistent with its well-known chronotropic effect36,37. High dose intravenous glucagon, causes a brief inotropic response by increasing cardiac output. This is primarily mediated via an increase in heart rate rather than changes to stroke volume or peripheral vascular resistance70. In comparison, lower doses71 do not appear to affect cardiac output or mean arterial pressure, suggesting a dose-dependent haemodynamic response72. Consistent with this, glucagon did not change LV ejection fraction or stroke volume in this study. Due to its potential inotropic properties, glucagon has long been evaluated as a potential treatment for symptomatic heart failure with data demonstrating mixed clinical outcomes73. Drawing conclusions on the clinical efficacy of glucagon in these studies is challenging due to their small size and lack of randomised control arms. The glucagon receptor (and mRNA transcripts) is not present in the sino-atrial node, atria or ventricles of organ donors and explanted hearts, where it also fails to demonstrate any inotropic or chronotropic effects74. One proposed mechanism for the above haemodynamic changes is glucagon induced activation of myocardial GLP-1 receptors70. Glucagon and native GLP-1 share 47% amino acid homology and have overlapping binding sites. Glucagon has around 140 times less affinity for the GLP-1 receptor (compared with specific GLP-1 agonists) meaning that at high concentrations glucagon may bind and activate the GLP-1 receptor75–77. Glucagon is also shown to stimulate catecholamine release from the adrenal gland78,79, activate the hypophysis–hypothalamus–adrenal axis80 and activate sympathetic activity in the hypothalamus81, indicating that some of the cardiovascular effects are conveyed, in part, through activation of the sympathetic nervous system74. Physiologically, glucagon promotes glycogenolysis and gluconeogenesis leading to an increase in blood glucose. Compensatory mechanisms increase insulin levels, and both hormones increase fuel availability in the heart82. In pre-clinical studies, glucagon and insulin are shown to increase glycolysis and glucose oxidation83. We observed a significant increase in MGU with glucagon and this is likely mediated through an increase in glucose availability or a reduction in free fatty acids. By comparison, in individuals without T2D, 0.5 mg intravenous glucagon increased MGU in the myocardium and skeletal muscle, although this was not significant84.
Exenatide:glucagon co-infusion significantly increased the 18F-FDG influx rate (Ki) and MGU, indicating a potential role of dual agonism in improving myocardial metabolism. With regards to the myocardial function measurements, strain and strain rate represent the magnitude and rate, respectively, of myocardial deformation which provides a quantitive measure of regional and global myocardial function85. Global longitudinal strain is a reliable and clinically relevant measure of early subclinical ventricular dysfunction and a predictor of heart failure related events86, cardiovascular mortality87 and all-cause mortality in patients with heart failure with reduced LV ejection fraction88. In patients with heart failure secondary to mitral regurgitation, an increase in LV longitudinal contraction (a 2.3 ± 2% reduction in LV global longitudinal strain) was associated with reduced mortality and hospitalisation rates for heart failure at six months89. Six months treatment with semaglutide or dulaglutide significantly improves global longitudinal strain as measured by transthoracic echocardiogram90. Exenatide:glucagon co-infusion numerically increased LV longitudinal contraction (0.6% reduction in LV global longitudinal strain) which although not-significant, requires further investigation. Global circumferential strain and global radial strain are two other measurable components of myocardial deformation which are less extensively studied91. It should be noted that global radial strain is associated with lower reproducibility compared with other measures92. There were no changes in either parameter following glucagon or exenatide:glucagon co-infusion. By contrast, exenatide: glucagon co-infusion significantly increased the LV global peak diastolic circumferential strain rate whereas the LV global peak diastolic radial strain rate significantly decreased. These data indicate that the diastolic changes in both the circumferential and radial direction are quicker which maybe reflective of improved diastolic function93. Several small studies report GLP-1 receptor agonists improve LV diastolic dysfunction in patients with T2D28,94, however neither of these investigated he effects of GLP-1/glucagon dual agonism. No significant changes in any systolic parameters, LV ejection fraction or stroke volume were observed in this study. We hypothesise that changes in MGU potentially proceed changes cardiac function and as such, measurable improvements of some cardiac parameters are only observed in the medium to long-term. This aligns with previously published data showing that changes in MGU using 18F-FDG-PET precede the morphological and mechanical changes in LV systolic dysfunction in db/db mice95. However, the relationship between myocardial glucose metabolism and cardiac function during the progression of diabetic cardiomyopathy is less clear96. Similarly, cardiac changes maybe harder to detect if the underlying abnormalities are grossly normal, which is broadly the case in this study. These findings warrant further evaluation in larger clinical trials, ideally using novel compounds, to establish whether there is a potential role for dual agonist therapy in treating diabetic cardiomyopathy or heart failure from any cause.
With the exception of glucose, no metabolic data were generated from the study. The authors acknowledge the combination infusion resulted in a greater area under the curve for glucose, compared to the glucagon infusion in isolation, although statistically, there were no differences between the two infusions (Fig. 4). This is likely reflective of the small sample size and the use of point of care glucose sampling, a potential source of pre-analytical and analytical errors97 which may also underestimate the true laboratory-based glucose level. From a metabolic perspective, it is evident that glucagon offsets the glucose lowering efficacy of exenatide. This highlights the importance of the respective ratios of GLP-1/glucagon dual agonist compounds for future treatments in metabolic populations, in order to avoid any deleterious effects.
To our knowledge, this is the first human study to explore the effects of GLP: glucagon dual receptor agonism on myocardial function and MGU. Data from haemodynamic early phase clinical trials of GLP-1/glucagon dual agonists demonstrates Cotadutide (MEDI0382)16,17,98, Survodutide (BI 456906)19,99 and Mazdutide (IBI362)100 increase heart rate and reduce blood pressure in patients with T2D or obesity. The GLP-1/glucagon dual agonist Pemvidutide (ALT-801), reduces blood pressure without leading to a clinically significant increase in heart rate18,101. Retatrutide, a triple agonist at the GIP, GLP-1 and glucagon receptor increases heart rate and decreases blood pressure in obese adults102. In addition to the beneficial effects on glucose metabolism and body weight, GLP-1/glucagon dual receptor agonists are shown to reduce liver glycogen and fat in overweight individuals with T2D17 and reduce the urinary albumin-to-creatinine ratio in overweight individuals with T2D and CKD16. Further research is required to evaluate these effects to see whether dual agonists improve symptoms and prognosis in patients with diabetic cardiomyopathy and other conditions linked with the metabolic syndrome.
| Study | Population | Study drugs Duration | PET tracer(s) | Outcome measures | Findings |
|---|---|---|---|---|---|
| Gejl et al., 2012[103] | 8 males with T2D | Exenatide 1.0 ng/kg/min (0.066 pmol/kg/min) saline | F-FDG18N-ammonia13 | MGU MBF | Exenatide had no effect on MGU. Exenatide increased MBF by 24% ( = 0.009). Linear relationship between the exenatide-induced alterations in MGU and insulin resistance ( = 0.010; r = 0.69).pp2 |
| Moberly et al., 2013[52] | 6 lean (saline) 7 lean (GLP-1) 7 T2D and obesity (GLP-1) | GLP-1 (7–36 amide) 1.5 pmol/kg/min saline overnight infusion | F-FDG18C-acetate11 | MGUMBFMPMVO2 | GLP-1 increased MGU by x2.8 in lean subjects, compared to untreated lean controls. GLP-1-stimulated rates of MGU in obese adults and T2D were similar to saline control. No differences MP, MVO, blood flow, CO or SV.2 |
| Gejl et al., 2014[104] | 18 healthy males | GLP-1 (7–36 amide) 1.2 pmol/kg/min i.v. saline 60–360 min | F-FDG18 | MGU | GLP-1 had no effect on overall MGU. GLP-1 increased MGU in those with a low baseline MGU (the most insulin resistant participants) and reduced MGU in those with a high baseline MGU. |
| Lepore et al., 2016[105] | NYHA II, III | Albiglutide 30 mg OD placebo 12 weeks | F-FDG18C-acetate PET11 | MGUMyocardial efficiencyMVO2 | Albiglutide had no effect on MGU ( = 0.59), myocardial efficiency ( = 0.90) or MVO( = 0.25)ppp2 |
| Nielsen et al., 2017[106] | 36 HF | Liraglutide 1.8 mg OD placebo 24 weeks | F-FDG18O-HO152 | MGU MBF Myocardial flow reserve | Liraglutide had no effect MGU ( = 0.98), MBF ( = 0.76) or myocardial flow reserve ( = 0.89)ppp |
| Chen et al., 2017[107] | 26 T2D with LV dysfunction 10 healthy controls | Exenatide 5 µg BD for 4 weeks then 10 µg BD Insulin glargine 26 weeks | C-acetate11[O] HO152 | MVO2Myocardial efficiency | Exenatide had no effects on cardiac function, perfusion or oxidative metabolism |
| Mather et al., 2018[108] | 27 T2D | Liraglutide 1.8 mg OD Insulin detemir Insulin detemir: liraglutide 12 weeks | F-FDG18C-acetate11C-palmitate11 | MGUMBFMPMVO2Fatty acid uptake and oxidation | No differences in MGU, MVO2, fatty acid oxidation, or fatty acid esterification. Liraglutide reduced MBF compared to insulin detemir ( = 0.01)p |
Limitations
The study is not without limitations. As this was an exploratory pilot study, the sample size was small (n = 8). Given the small study numbers, data were not analysed according to gender or so we are unable to exclude this as a confounder. Participants were also on a number of potentially confounding anti-diabetic medications including metformin (n = 5) and SGLT2i (n = 1). The study involved exposure to ionising radiation and therefore the decision was taken to exclude females of childbearing potential from the study. Observed haemodynamic effects may have been affected by other hormones including insulin and glucose. The glucagon and exenatide:glucagon infusion visits were performed on a different day to the baseline (saline) scan meaning other confounding variables may have influenced the imaging results. The infusion duration was short (150 min), and therefore extrapolating the effects on myocardial function and MGU beyond this time point is not possible. GLP-1 and glucagon receptor occupancy and activation rates differ compared to molecules in clinical development meaning caution should be applied when drawing comparisons with the effects of novel compounds.
The baseline MGU in our study (saline infusion) was 0.009 µmol/g/min. This was significantly lower than other published prior PET studies in T2D in the fasted state (0.13 ± 0.07 µmol/g/min103, 0.17 ± 0.05 µmol/g/min104, 0.42 ± 0.12 µmol/g/min8). The low MGU meant it was challenging to sufficiently delineate the regions of interest with a high degree of certainty. Automated regions of interest analysis were not possible meaning that manually defined regions of interest was applied which can be subjective. This limited the analyses to a single MGU estimate for the entire myocardium, and thus, potential regional changes could not be further explored. In 11 PET scans, patient motion was considerable enough to result in a misalignment between the attenuation map and the emission data meaning re-reconstructed PET images were analysed using the manual region of interest definition. For cardiac MRI, one of the acquired SAX (one visit for one subject) was not analysable due to motion artefacts and therefore imputation using the median was used for statistical analysis.
Conclusion
This is the first human study to evaluate the effects of dual GLP-1/glucagon agonism on cardiac function and MGU. Exenatide:glucagon co-infusion was well tolerated with a good safety profile. In this pilot study, exenatide:glucagon co-infusion increased MGU and improved the LV global peak diastolic circumferential strain rate and the LV global peak diastolic radial strain rate. Further studies are required to explore whether GLP-1/glucagon dual receptor agonists improve heart failure related outcome measures in patients with T2D.