
What this is
- This research investigates the genetic risk of β-cell dysfunction associated with the MTNR1B risk variant in type 2 diabetes (T2D).
- Using human induced pluripotent stem cells (hiPSCs) and embryonic stem cells (hESCs), the study explores the effects of the rs10830963 on insulin secretion.
- The findings indicate that while MTNR1B protein levels are higher in risk allele carriers, the β-cells derived from these cells show limited maturity and functionality.
Essence
- The study examines how the MTNR1B risk variant influences β-cell function in T2D. Despite higher MTNR1B protein levels in risk allele carriers, β-cells derived from these cells do not mature sufficiently to confirm the 's role as an .
Key takeaways
- Elevated MTNR1B protein levels were observed in β-cells carrying the G-risk allele. This aligns with the 's role as an expression quantitative trait locus () but does not translate to increased mRNA levels.
- Insulin secretion was comparable between genotypes under high glucose and IBMX stimulation, but the G-allele carriers showed a nominally reduced insulin release when melatonin was added, suggesting heightened sensitivity.
- The study indicates that β-cells derived from hiPSCs and hESCs exhibit limited responsiveness to glucose, raising questions about the maturity of these cells in modeling T2D.
Caveats
- The study's findings are limited by the immature state of the stem cell-derived β-cells, which may affect the interpretation of the results regarding the 's functional impact.
- The nominal increase in melatonin sensitivity observed in G-allele carriers requires further validation in more mature β-cell models to establish its significance.
Definitions
- eQTL: An expression quantitative trait locus (eQTL) is a genomic region that influences the expression levels of genes.
- SNP: A single-nucleotide polymorphism (SNP) is a variation at a single position in a DNA sequence among individuals.
Simplified
Introduction
Pancreatic β‐cells reside in small clusters of endocrine cells, termed the islets of Langerhans, which are dispersed throughout the exocrine parenchyma. The β‐cells secrete insulin, a hormone with glucose lowering effects, in response to nutrients absorbed after a meal. This maintains blood glucose levels within a narrow physiological range.
Type 2 diabetes (T2D) is a metabolic disease, the prevalence of which continues to increase globally and represents a major cause of morbidity and mortality. β‐cell function (i.e., the capacity to secrete insulin) plays a crucial role in the development of T2D, as failure to compensate for an increased demand for insulin owing to insulin resistance is central to the pathogenesis of the disease. Although both insulin resistance and β‐cell dysfunction are hallmarks of T2D, impaired insulin secretion is the culprit as insulin resistance alone does not result in T2D [1, 2, 3]. This notion has been further corroborated by genome‐wide association studies (GWAS) of T2D and related traits, which have identified more than 1000 robust genetic association signals [4] that mainly map to genes implicated in β‐cell function [5]. One such genetic signal maps to the MTNR1B locus; rs10830963, a single‐nucleotide polymorphism (SNP), located in the intron of the MTNR1B gene. It is one of the most robustly replicated risk variants for hyperglycemia and diminished insulin secretion related to T2D development. Carriers of the G‐risk allele exhibit decreased capacity to release insulin, increased fasting plasma glucose and a greater risk of developing T2D (or gestational diabetes) as compared to carriers of the nonrisk allele C‐allele [2, 6, 7, 8, 9]. In addition, rs10830963 is an expression quantitative trait locus (eQTL) conferring increased expression of MTNR1B mRNA in islets from risk allele carriers [2]. Indeed, the correlation between disruptions in circadian rhythm, partly regulated by melatonin, appears to increase the risk of type 2 diabetes (T2D) [10].
Despite the strong genetic association of the rs10830963 SNP with T2D and related traits, the precise molecular mechanisms underpinning the role of melatonin signaling in the pathogenesis of T2D have not yet been determined. To this end, we have shown that rs10830963 is an eQTL, conferring increased expression of MTNR1B mRNA in human islets of Langerhans [2]. Studies in clonal β‐cells (INS‐1) showed that melatonin reduces both insulin secretion and levels of intracellular cAMP [11, 12], whereas Mt2 (Mt2 being the equivalent of the human MTNR1B gene) knockout mice display an increase in insulin secretion from isolated islets due to loss of Mt2 signaling [6]. Indeed, the MTNR1B receptor signals via inhibitory G‐proteins (Gi) [13], when activated by melatonin, thus abrogating insulin secretion by reducing cAMP. In addition, daily administration of melatonin accentuates the repression of insulin secretion in MTNR1B G/G risk allele carriers [6]. Bioinformatics and functional analyses support a pathogenic role of rs10830963, where the risk SNP introduces a putative binding site for the transcription factor NEUROD1, which potentially drives the increased expression of MTNR1B in β‐cells [14]. While these observations collectively support a pathogenic role of melatonin signaling in T2D, a causal relationship between rs10830963 (G/G vs. C/C at this position in the DNA) is yet to be established.
Here, we describe a stem cell‐based approach to delineate the role of the MTNR1B rs10830963 risk allele in β‐cell function. Homozygous individuals carrying the G‐risk allele were identified and induced pluripotent stem cells (hiPSC) were generated from fibroblasts in skin biopsies. Isogenic, homozygous nonrisk C‐allele hiPSC, were created by single‐base genome editing. Additionally, human embryonic stem cells (hESC) were genome‐edited to generate cells homozygous for risk (G) and nonrisk (C) alleles. Subsequently, cells carrying risk‐ and nonrisk alleles were transcriptionally, morphologically, and functionally compared to gain information about a potential causal relationship between rs10830963 in β‐cells and T2D.
Material and Methods
Ethical Statement
All participants provided informed consent for donating a skin biopsy. The study was approved by the Swedish Ethical Review Authority, with the ethical statement number Dnr 2019‐05157.
Preparation of Human Dermal Fibroblasts From Adult Skin Biopsies
Patients were recruited from "Detailed assessment of T2D" (DIACT), a sub‐group of ANDIS (All new diabetics in Scania, https://www.andis.lu.se/startsida↗). A 4.0 mm skin punch biopsy was collected, cut into 0.5–1 mm pieces, and placed in a 6‐well plate containing medium (DMEM, 10% FBS, Pen/Strep, Sigma Aldrich, D6429). A cover slip was placed over the biopsy pieces to fix them to the bottom of the plate. Following incubation for 7–10 days at 37°C, 5% CO2, a dense outgrowth of fibroblasts appeared which adhered to the cover slip. Fibroblasts from the cover slip were collected, using trypsin, and further expanded in T‐25 tissue culture flasks as described [15]. Cells were stored in liquid nitrogen or were directly subjected to reprogramming into iPSC.
Reprogramming of Dermal Fibroblasts to iPSC
Reprogramming into hiPSCs was performed in a complete xeno‐free culture environment, using nonintegrating, nonmodified RNAs from a highly efficient and robust Stemgent StemRNA 3rd Gen Reprogramming kit (REPROCELL, Cat. No. 00‐0076). This RNA‐based method combines a cocktail of synthetic, nonmodified reprogramming (OCT4, SOX2, KLF4, cMYC, NANOG, and LIN28) and immune evasion mRNAs (E3, K3, B18) with reprogramming‐enhancing mature, double‐stranded microRNAs from the 302/367 cluster. Use of live staining with Stain Alive TRA‐1‐60 antibody enabled verification and selection of pluripotent clones. More detailed information can be accessed from REPROCELL guidelines.
Sequencing ofExon 1 and rs10830963 Alleles From iPSC and hESC MTNR1B
DNA was extracted using DNeasy Blood & Tissue Kit (Qiagen, 69506) or QuickExtract DNA Extraction Solution (Lucigen, QE09050). To genotype the rs10830963 locus, a 601 bp genomic region (chr11:92,975,259‐ 92,975,860, genome build hg38) was amplified with the primers 5′‐TCCAAGTAGCAGTCAGAAGC‐3′ and 5′‐CCAAGTGACATCTCAATGAG‐3′. To determine MTNR1B knockout efficiency, a genomic region including the CRISPR/Cas9‐targeted exon 1 (chr11:92,969,727‐92,970,084, genome build hg38) was amplified with the primers 5′‐ TGTCAGAGAACGGCTCCT‐3′ and 5′‐ GGAATAGGTTAGAGTGAAGGGAAAG‐3′. AmpliTaq Gold Master Mix 360 (ThermoFisher, 4398881), at recommended cycling settings, (1 cycle 95°C for 10 min, then 40 cycles of 95°C for 15 s, 58°C for 30 s, 72°C for 45 s, then 1 cycle 72°C for 7 min) was used. PCR amplicons were purified using GeneJET PCR Purification Kit (ThermoFisher, K0701) and Sanger‐sequenced using either the forward 5′‐GTAGCAGTCAGAAGCTGTGGTC‐3′ or the reverse 5′‐GCCTTCCAGAGCCTTTGTTCAG‐3′ sequencing primer (for rs10830963 genotyping) or the 5′‐ATAGGTTAGAGTGAAGGGAAAGGG‐3′ sequencing primer (for MTNR1B knockout). The knockout efficiency (indel percentage) was determined using an online tool supplied by Synthego (https://ice.editco.bio/↗).
Genome Editing of rs10830963 Using CRISPR/Cas9 in iPSC and hESC
Cas9 protein Alt‐R v3 (1072544, HDR enhancer, electroporation enhancer 1075916), as well as custom‐made sgRNA and ssDNA were from Integrated DNA Technologies (Coralville, Iowa, USA). For single‐base editing, to target the risk G‐allele and the nonrisk C‐allele, the spacer sequences TACTGGTTCTGGATAGCAGA and TACTGGTTCTGGATAGGAGA, respectively, were used in single guide RNAs. The synthetic ssDNA homology‐directed repair donor template for the G‐to‐C allele editing was 5′‐GCAGAATATTCCCATCAGGAACCTCCCAGGCAGTTACTGGTTCTGGATAGGAGATGGTGTGAATTCTTAGCATCACTGGGGGCCTGGAGGAGGGGCAGCT‐3′, and for the C‐to‐G allele editing 5′‐GCAGAATATTCCCATCAGGAACCTCCCAGGCAGTTACTGGTTCTGGATAGCAGATGGTGTGAATTCTTAGCATCACTGGGGGCCTGGAGGAGGGGCAGCT‐3′. For MTNR1B knockout, single guide RNA targeting exon 1 of MTNR1B was used, with the spacer sequence 5′‐GTTGCCCACGACGTCCACGG‐3′. To perform the genomic editing, 135 pmol Cas9 protein Alt‐R v3 were incubated with 150 pmol sgRNA for 30 min before adding 400 pmol electroporation enhancer and for single‐base editing only, 200 pmol ssDNA donor template. The reagents were mixed with 1 million cells resuspended in 100 μL human stem cell buffer kit 2 (Lonza, VCA‐1005); the cells were electroporated using the Amaxa nucleofector IIb program B‐016. For single‐base editing, cells were then placed in culture medium supplemented with 30 μM HDR enhancer and incubated at 32°C for 2 days before moving to 37°C. For knockout editing, the cells were incubated directly in 37°C. After 5 days, an aliquot of cells was used to extract the DNA by QuickExtract DNA Extraction Solution (Lucigen, QE09050). To assess the genomic editing efficiency, PCR amplicons were generated and sequenced as described above. Then, cells were seeded at low density, 500 cells per 10 cm dish, to generate single‐cell clones. Clonal DNA was extracted and PCR of DNA sequence comprising rs10830963 was performed as above. PCR products were screened for allele editing using BsaXI restriction enzyme digests (the C allele creates a BsaXI restriction site), and the edited clones' PCR amplicons were Sanger‐sequenced to confirm proper allele editing and absence of indels.
Culture, Maintenance and Freezing of iPSC and hESC
Before differentiation, stem cells were 2D cultured in laminin‐coated (1:20; BioLamina, LN521‐05) T25 flasks with Essential 8 complete medium (for iPSCs, Life Technologies A1517001 and Nutristem Media (for ESCs, Nordic Diagnostica, 05‐100‐1A). Thawing frozen cells required media to be supplemented with RevitaCell supplement (1:100; ThermoFisher, A2644501) for the first 24 h of culture. Upon 80% confluency, cells were washed with DPBS‐/‐ (ThermoFisher, 14040117) and dissociated into single cells using TrypLE select (ThermoFisher, 12563011) for 5 min at 37°C in incubator. Rho kinases inhibitor (10 μM) (Sigma‐Aldrich, Y‐27632A, CAS 146986‐50‐7) was added after every round of passaging for the first 24 h of culture. For freezing of cell stocks, dissociated cells were resuspended in the appropriate volume of PSC cryopreservation medium (Gibco, A2644601) and subsequently stored at −80°C for a day and then transferred to a liquid nitrogen tank for long term storage. Upon defrosting and before culture, hiPSCs generated from fibroblasts and hESCs cell (HUES4) line show robust protein expression of pluripotency markers OCT4 and TRA‐1‐81 (Supporting Information S1: Figure ). 1
2D Differentiation of hiPSC/hESC to β‐Cells
Pluripotent cells (⁓100,000 per well) were plated on laminin‐coated (BioLamina, LN521‐05) 12‐well cell culture plates. Differentiation commenced according to a modified protocol [16] and was initiated when cell culture reached ⁓ 95% confluency, and the current stage was designated as differentiation day 0. For Day 0–5, all cells were cultured in RPMI (ThermoFisher, 61870‐044) medium; Day 5–50 cells were cultured in DMEM‐F12 (ThermoFisher, 31331‐093). The cell media (1 mL/well) were supplemented with factors at each developmental stage as follows. Day 0–1, Activin A (100 ng/mL) (Peprotech, 120‐14E), CHIR99021 (3 μM) (Sigma Aldrich, SML1046‐5MG). Day 1–5, Activin A (100 ng/mL) and B27‐insulin (ThermoFisher, A1895601). Day 5–8, Retinoic Acid (2 μM) (Sigma Aldrich, R2625‐50MG). Day 8‐11, FGF2 (64 ng/mL) (Peprotech, 100‐18B). Day 11‐14, TPB (PKC activator; (2S,5S)‐(E,E)‐8‐(5‐(4‐(trifluoromethyl) phenyl)‐2,4‐pentadienoylamino) benzolactam (0.5 μM) (Santa Cruz, 497259‐23‐1) and Noggin (100 ng/mL) (Peprotech, 120‐10C). Day 15‐17, Forskolin (10 μM) (Sigma Aldrich, f3917‐25mg), Alk5i (4.5 μM) (SantaCruz, sc‐221234A), Noggin (100 ng/mL) (Peprotech, 120‐10C), Nicotinamide (10 mM) (Sigma Aldrich, N0636‐100G). Day 17–30 Forskolin (10 μM) (Sigma Aldrich, f3917‐25mg), Alk5i (4.5 μM) (SantaCruz, sc‐221234A), Noggin (100 ng/ml) (Peprotech, 120‐10C), Nicotinamide (10 mM) (Sigma Aldrich, N0636‐100G). In addition, Day 5–50 differentiation media were supplemented with B27 (ThermoFisher, 17504044). Cell culture medium was replaced every 24 h from Days 0–17 and every 48 h from Days 17–50.
Immunoblotting
Cell extracts were prepared using RIPA buffer (Sigma, R0278) supplemented with Pierce Protease Inhibitor Cocktail (ThermoFisher, A32963); the protein concentrations were quantified by BCA protein assay (ThermoFisher, 23225). 20 μg protein were run on a 4%–20% reducing SDS‐PAGE Mini‐PROTEAN TGX gel (BioRad, 4568094), and transferred to a PVDF membrane (BioRad, 1704157) that was blocked for 1 h in 5% BSA (Sigma, A4503) in TBS (Biorad, 170‐6435). Next, the membrane was immunoblotted for 16 h at 4°C in blotting buffer (3% BSA in TBS with 0.1% Tween‐20 (Sigma, P7949) with 1 μg/mL rabbit anti‐MTNR1B (ThermoFisher, PA5‐102107), washed 4 × 5 min in washing buffer (TBS with 0.1% Tween‐20), then incubated for 1 h at room temperature with 0.1 μg/mL HRP‐conjugated goat anti‐rabbit (BioRad, 162‐0177) in blotting buffer, washed 4 × 5 min with washing buffer, then developed using Clarity Western ECL substrate (BioRad, 1705060) and a CCD camera. For reprobing, the membrane was stripped with Restore Western blot analysis Stripping Buffer (ThermoFisher, PIER21059), and the procedure was repeated as above but using 0.2 μg/mL mouse mouse anti‐α‐tubulin (Abcam 7291) as primary, and 0.1 μg/mL HRP‐conjugated goat anti‐mouse antibody (BioRad, 1706516) as secondary antibody. The bands on the immunoblots were quantified using ImageJ software (NIH). The MTNR1B signal was normalized to the β‐tubulin signal.
Immunocytochemistry
hiPSC, hESCs and fully differentiated cells were fixed directly on the culture plates with 4% paraformaldehyde (PFA, Histolab, 2176) for 30 min at room temperature (RT), permeabilized with 0.1% triton X‐100 (Sigma) in PBS (Gibco) for 15 min at RT and blocked with blocking buffer (5% normal donkey serum (NDS) (Abcam, ab7475) + 1% bovine serum albumin (BSA, Sigma, 05482) + 0.1% Tween‐20 (Sigma, P7949) in PBS (Gibco, 18912014) overnight at RT. Primary and secondary antibodies used in this study are described in Supporting Information S1: Table . Primary antibody incubation was overnight at 4°C followed by incubation with secondary antibodies in blocking buffer overnight at RT (1:1000, ThermoFisher). Nuclei were stained with 4′,6‐diamidino‐2‐phenylindole, dihydrochloride (DAPI, 1:2000, ThermoFisher, 62248) in 1% BSA in PBS for 10 min at RT. Cells were covered with fluorescence mounting medium (DAKO, S3023) and stored at 4°C. Images were captured by a laser scanning confocal microscope (LSM780, Zeiss). Final images were processed and compiled using Adobe Photoshop and InDesign. Antibodies are described in Supporting Information S1: Table . S1 S1
qRT‐PCR on iPSC and hESC During Differentiation Stages
RNA at the defined stages of differentiation (Day 0, 1, 5, 8, 11, 14, 17, 27, 35, 50) was extracted using RNeasy Plus mini kit (Qiagen, 74136) according to the manufacturer's guidelines. cDNA synthesis with 500 ng total RNA (bulk cells) was performed using RevertAid first strand cDNA synthesis kit (ThermoFisher, K1622) according to the manufacturer's guidelines. Real‐time qPCR reactions were set up in duplicates for each sample, using Taqman assays and Taqman Universal master mix (ThermoFisher, 4305719) in real‐time qPCR system (Applied Biosystems, Quant Studio 7 Flex) using StepOnePlus software. qRT‐PCR data were normalized to the geometric mean of two housekeeping genes (TBP, TATA‐box binding protein) and PPIA (Cyclophilin A), using the ΔCT method. All TaqMan assays used in this study are listed in Supporting Information S1: Table 2.
pLenti‐HIP‐GFP Virus Production
Lentiviral vectors were generated, as previously described [17], with titers ranging from 107 to 108 TU/mL and determined by fluorescence‐activated sorting (FACS). Briefly, HEK293T cells were cultured to reach a confluency of 80%–90% on the day of transfection. For the production, third‐generation packaging, and envelope vectors (pMDL, psRev, and pMD2G) were used in conjunction with Polyethyleneimine (PEI Polysciences PN 23966) in DPBS (Sigma Aldrich, D8537). The supernatant was then collected, filtered, and centrifuged at 25,000 g for 1.5 h at 4°C. The supernatant was removed from the tubes and the virus was resuspended in PBS (Sigma Aldrich, P4474), and left at 4°C. The resulting lentivirus was aliquoted and stored at −80°C. Generated lentivirus was tested and titrated in human EndoC‐βH1 line (Supporting Information S1: Figure S4).
Fluorescence‐Activated Cell Sorting
At Day 45 of differentiation, cells were infected with pLenti‐HIP‐GFP virus (MOI = 2). Five days post‐transduction, robust GFP green fluorescence appeared in β‐cells. For FACS, single cells were prepared using TrypLE select (ThermoFisher, 12563011). All washes were performed in FACS buffer (2% FBS (Sigma Aldrich, A7030‐100G) in DPBS‐/‐ (ThermoFisher, 14040117). Cellular debris were removed as described by the manufacturer's guidelines (Miltenyibiotec, 130‐109‐398). Cells were filtered through 30uM filter (BD Biosciences, 340627) and sorted (BD Aria Fusion) for GFP+ cells (Supporting Information S1: Figure S5) in Eppendorf tubes containing FACS buffer. Cells were redistributed in lysis buffer (Norgen Biotech 51800) and stored in −80°C.
qRT‐PCR on Sorted β‐Cells
Sorted, GFP‐expressing β‐cells were subsequently processed to obtain RNA, using Single Cell RNA Purification Kit (Norgen Biotech 51800). RNA was quantified by nanodrop spectrophotometer (ND‐1000). cDNA was synthesized from 50 to 80 ng of total RNA according to manufacturer's protocols using SuperScipt IV VILO Mastermix with ezDNASE Enzyme kit (ThermoFisher, 11756050). Real‐time qPCR reactions were set up in duplicates for each sample using Taqman assays and Taqman Fast Advanced master mix (ThermoFisher, 4444556) in real‐time qPCR system (Applied Biosystems, Quant Studio 7 Flex) using StepOnePlus software. qRT‐PCR data were normalized to the geometric mean of two housekeeping genes (TBP and PPIA using the ΔCT method. All TaqMan assays used in this study are listed in Supporting Information S1: Table S2.
Insulin Secretion
Differentiated β‐cells from hESCs and hiPSCs cultured until Day 50–60 in 12‐well plates, were starved in secretion assay buffer (SAB; 114 mmol/l NaCl, 4.7 mmol/l KCl, 1.2 mmol/l KH2PO4, 1.16 mmol/l MgSO4, 25.5 mmol/l NaHCO3, 20 mmol/l HEPES, 2.5 mmol/l CaCl2 and 0.2% BSA (fatty acid free), pH 7.2) supplemented with 1 mM glucose at 37°C for 2 h. Following starvation, cells were stimulated for 1 h with SAB containing either low glucose (LG, 1 mM), high glucose (HG, 20 mM) or HG + IBMX (50 μM or 100 μM). Each of the four treatments was performed in the presence or absence of 100 nM melatonin (Sigma, M5250). Supernatant was collected from the wells and centrifuged (4000 × g, 5 min, 4°C). To quantitate intracellular insulin and protein, cells were rinsed in the wells with DBPS and lysed with ice‐cold RIPA buffer supplemented with protease/phosphatase inhibitor (ThermoFisher, A32961), scraped from the well bottom and rotated on a shaker (1600 rpm, 30 min, 6°C). Lysates were centrifuged (12 000 × g, 15 min, 4°C) and supernatant collected. Insulin was quantified using human insulin ELISA kit (Mercodia, 10‐1113‐10) according to the manufacturer's guidelines. Insulin concentration in the samples was interpolated from the standard curve using cubic spline regression (Prism/GraphPad). Protein concentration was determined with Pierce BCA Protein Assay Kit (ThermoFisher, 23225).
Data Analysis and Interpretation
Statistical testing for two groups was performed using two‐tailed Student's t‐test and the Mann–Whitney U test was applied when normal distribution was not apparent. A p value of < 0.05 was considered statistically significant. Data are presented as mean±SD. Insulin secretion data were calculated as fold secretion of glucose control (low glucose [LG]) and presented as nominal data. Data are presented as mean±SD. All graphs and analyses were undertaken using the Graphpad Prism 10 software.
Results
CRISPR‐Cas9 Editing of hiPSC and hESC at theLocus MTNR1B
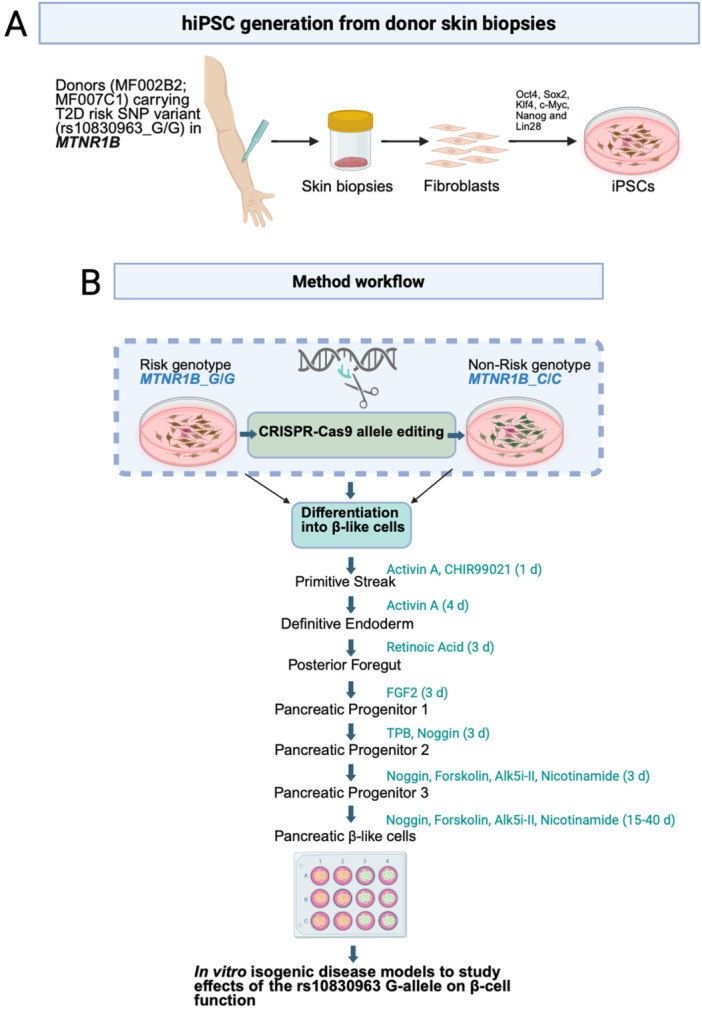
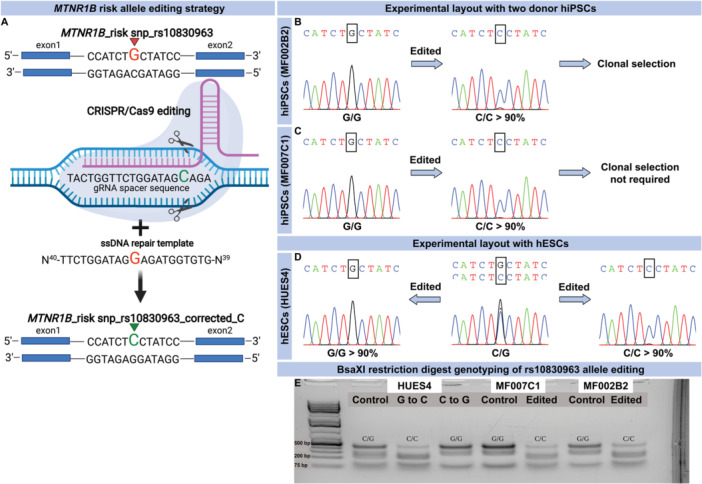
hiPSC from two human donors (MF002B2 and MF007C1) diagnosed with T2D were subjected to single‐base genome editing of the MTNR1B (rs10830963) risk allele (G/G), using CRISPR/Cas9 (See Table 1A–C for patient information and Figure 1A,B for work‐flow of skin biopsy procurements for generation of hiPSC with genome editing and subsequent differentiation to β‐cells). Isogenic hiPSCs were generated carrying nonrisk variants (C/C); editing efficiency was > 90% (Figure 2A–C). In addition, the hESC line, HUES4 [18], was edited at the MTNR1B locus (original genotype C/G) to either C/C (nonrisk) or G/G (risk), respectively (Figure 2D), with an efficiency comparable to that in hiPSC clones. Successful editing was confirmed by BsaXI enzyme restriction digestion, where cutting of DNA with G/G risk genotype generated a 510 bp DNA band while DNA with C/C nonrisk genotype generated a 210 bp band (Figure 2E). Before differentiation of hiPSC and hESC to β‐cells, MTNR1B protein was readily detected by immunocytochemistry in all iPSC cultures. MTNR1B protein was observed throughout the cytosolic compartment as well as in the plasma membrane (see enhanced images; Supporting Information S1: Figure S2).

Graphical representation of derivation of hiPSCs and reprogramming into β‐ cells in vitro. (A, B) The image illustrates the workflow of procuring skin biopsies from patients, hiPSC reprogramming, single base genome editing, and differentiation into β‐cells. (B) The procedure creates two isogenic cell lines, which differ only with respect to one single base, that is, the single‐nucleotide polymorphism (SNP) that constitutes the risk allele. Image created in Biorender.

Genome editing of the(rs10830963) risk allele and edited clone selection strategy. (A) The graphical representation shows the sequence surrounding rs10830963 in the intron of the. G, indicated by red arrowhead, is the minor allele conferring the increased risk of impaired insulin secretion and future risk of T2D. A guide RNA (in purple)‐targeting Cas9 to this sequence was prepared and introduced to hiPSCs along with a single strand (SS) DNA template which contains a G instead of a C, thus G will be transcribed to a C (green) instead of a G, resulting in a correction of the G‐risk allele. (B–C) Sanger sequencing of DNA in hiPSCs carrying the homozygous (G/G) risk allele ofand upon editing; sequencing after single base gene editing in a pool of hiPSC where the vast majority of cells now carries the nonrisk C‐allele. Image created in Biorender (A) A small peak below the major peak indicates that a minor fraction of cells still remains unedited. (B) MF002B2 edited cells were expanded and clonal cell lines were selected as pure edited and control lines. (C) As the editing efficiency was more than 90%, clonal selection for edited MF007C1 cells was not performed. (D) hESCs (HUES4) are normally heterozygous G/C genotype at the rs10830963 locus ingene. Therefore, these cells were edited both ways from G to C and C to G in parallel to create cell lines carrying homozygous nonrisk C/C and risk G/G risk alleles. Editing efficiency was more than 90%, hence no clonal cell lines were prepared. (E) Editing was also assessed by BsaXI restriction digestion where G/G risk genotype resulted in a prominent DNA band at a roughly 510 bp size and C/C nonrisk genotype at a roughly 210 bp size. MTNR1B MTNR1B gene MTNR1B MTNR1B
| 1A. | ||||
|---|---|---|---|---|
| Donor ID | AGE | BMI | Fasting glucose | MTNR1B genotype rs10830963 |
| MF002 | 71 | 27.53 | 7.6 | G/G risk |
| MF007 | 63 | 36.09 | 9.5 | G/G risk |
Differentiation of hiPSC and hESC Into β‐Cells
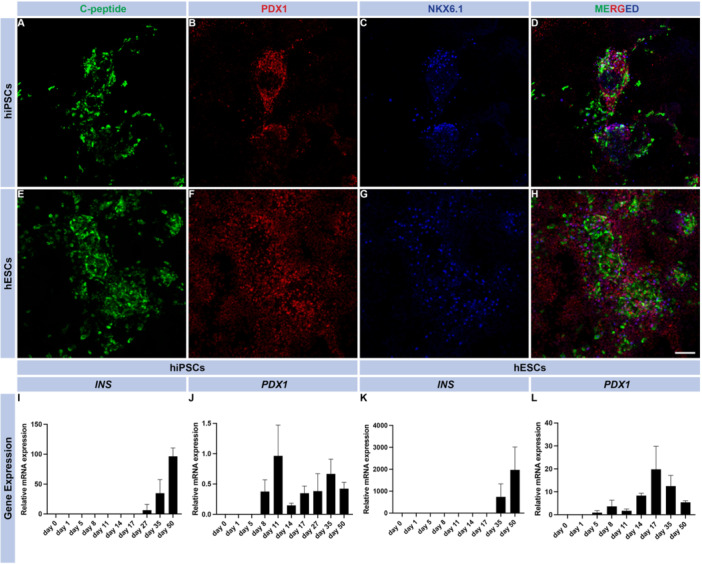
Successfully edited hiPSC and hESC clones were differentiated into β‐cells employing a protocol for 2D‐culture [16], where addition of small molecules and growth factors enabled pancreatic and islet cell development (Figure 1B). All clones were immunohistochemically evaluated following differentiation, using immunocytochemistry for pancreatic endocrine markers (PDX1 and NKX6.1) as well as C‐peptide during the later stages of differentiation (Figure 3A–D for hiPSCs; E–H for hESCs). Importantly, INS (insulin mRNA) was expressed in both hiPSC‐ and hESC‐derived cells from Day 35 (Figure 3I,K). This was also confirmed at the protein level by immunohistochemical staining of hiPSC and hESCs with antibodies to C‐peptide at day 50 of differentiation (Figure 3A,E). Of note, INS expression was approximately 20‐fold higher in the hESCs as compared to hiPSCs (Figure 3K vs. 3I), suggesting a higher capacity of hESCs to differentiate into β‐cells. Similarly, PDX1 expression was observed at day 8 of differentiation in both hiPSC and hESC: its expression varied during the course of differentiation; hESCs expressed PDX1 at a 10‐fold higher level than hiPSCs at the end of the protocol (Figure 3L vs. 3J). Insulin (C‐peptide staining) was distributed in cells throughout the culture plate (Supporting Figure 3 ‐ tile scans; A and B, hiPSC clones and C, hESCs). Immunohistochemical staining revealed both insulin‐ and glucagon‐positive cells, with some bi‐hormonal cells also observed in the cell cultures (Supporting Information S1: Figure S3D–F). Glucagon (GCG) gene expression in hiPSCs and hESCs was detected from Day 35 in hiPSC and hESCs (Supporting Information S1: Figure 3G,H respectively). Importantly, GCG gene expression was approximately 18‐fold lower than INS gene expression in hiPSC derived endocrine cell cultures and 10‐fold lower in hESC derived endocrine cell cultures.

hiPSC and hESC lines and β‐cell differentiation characterization. Immunocytochemistry images of differentiated hiPSCs and hESCs that display C‐peptidecells (β‐cells in green) co‐expressing PDX1 (red), and NKX6.1 (blue) in fully differentiated cells at Day 50 of differentiation (A–H). The scale bar represents 100 μm, and the images were captured at 20× magnification with a confocal microscope. Gene expression profile ofandin hiPSC and hESC derived β‐cells differentiated for 50 days (I–L) ( = 3 biological replicates, mean ± SD). + INS PDX1 N
TheRisk Variant rs10830963 Is Associated With Altered Protein but Not mRNA Levels ofin hiPSC Differentiated to β‐Cells MTNR1B MTNR1B
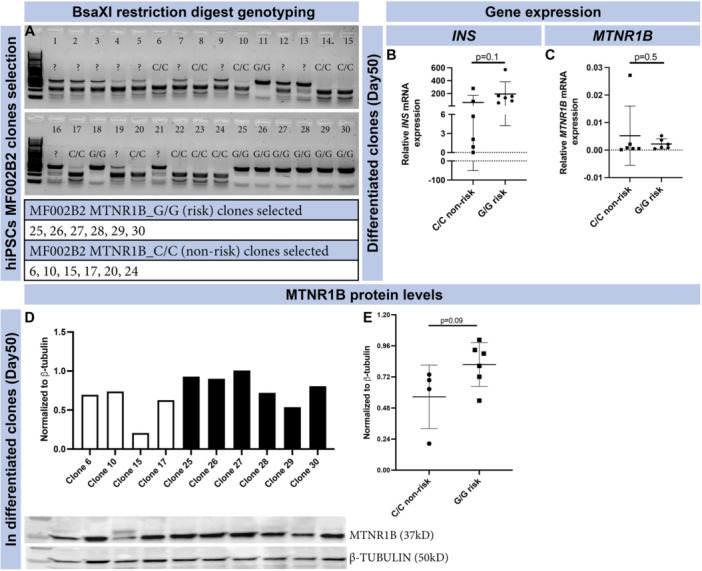
To determine whether the MTNR1B risk and nonrisk variant impacted expression of MTNR1B, we used isogenic clones of hiPSC carrying either edited (C/C; nonrisk) and nonedited (G/G; risk) MTNR1B alleles (Figure 4A). Six clones of each genotype (C/C and G/G) were chosen, using 2D‐cultures for subsequent differentiation of hiPSC into β‐cells. At Day 50 of differentiation, expression of INS and MTNR1B was determined by qPCR (Figure 4B,C). No difference in INS or MTNR1B expression was observed between the genotypes (six clones/genotype from one patient donor). At the protein level, however, western blot analysis demonstrated a trending increase (p = 0.09) of MTNR1B protein in β‐cells carrying the G/G risk allele (Figure 4E). To validate the specificity of the antibody used in our western blot, we utilized one of our hiPSC lines to generate an MTNR1B knockout line, performing CRISPR/Cas9 mediated deletion of exon 1 in the MTNR1B gene. Importantly, this cell line was not clonally selected (i.e., generated from a single cell)—thus, we expexted a mixed cell population of cells maintaining the intact gene and cells containing the knockout. We compared the abundance of the MTNR1B protein in the MTNR1B knockout line and isogenic controls by western blot (Supporting Information S1: Figure S6A); we observed a significant reduction of the protein in the knock out line (p = 0.007; Supporting Information S1: Figure S6B). Quantification of knockout efficiency of cells was perfomed by Sanger sequencing, The analysis shows 26% knockout‐generating indel mutations ( +1 and −1 base pair) in the cell population after transfection with the denoted guide target (Supporting Information S1: Figure S6C,D). Original blots and ladder are depicted in (Supporting Information S1: Figure S6E–G).
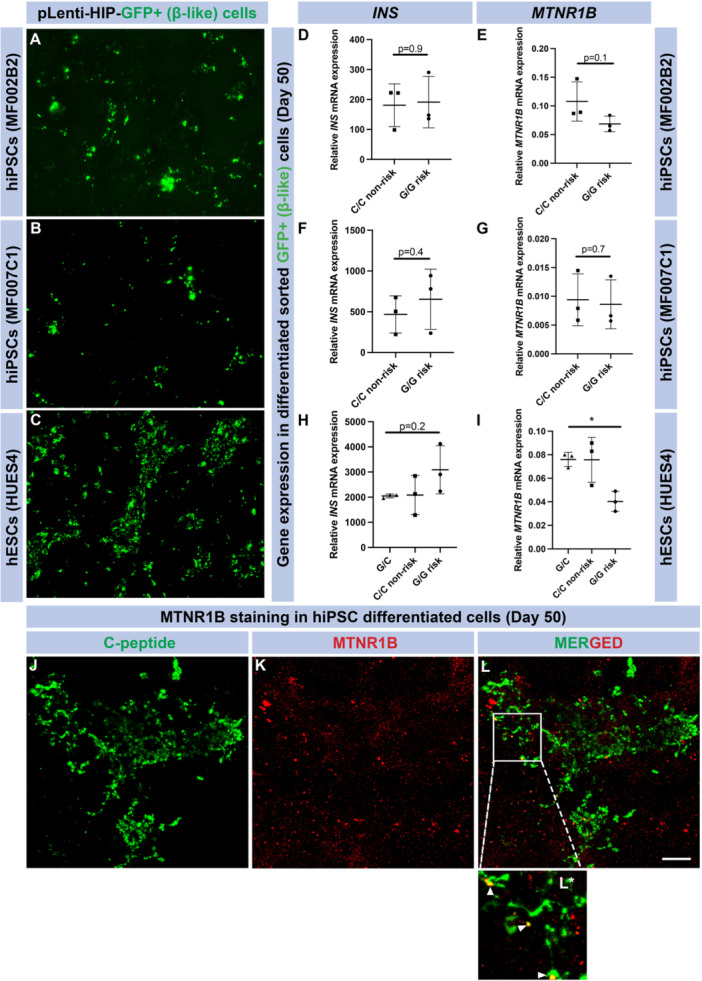
To enhance detection of differences in MTNR1B expression in β‐cells from isogenic risk and nonrisk allele carriers, we further increased the proportion of β‐cells by FACS of edited and nonedited hiPSC and hESCs. Five days before FACS, cell lines were infected with a pLenti vector expressing green florescent protein (GFP) under the control of the human insulin promoter (HIP; MOI 2; Figure 5A–C). Hereby, insulin‐producing cells would be detected and amenable to sorting by FACS (Supporting Figure 5A–C). Next, we investigated the expression of INS and MTNR1B in these cell preparations (Figure 5D–I). Again, we were unable to detect any differences in mRNA expression of either INS or MTNR1B in the β‐cells derived from hiPSC with the G/G and C/C genotypes, respectively. Surprisingly, we observed reduced MTNR1B gene expression (p = 0.02) in β‐cells derived from hESCs carrying the G/G risk allele compared with hESCs of the C/C genotype (Figure 5I). This is contrary to what we previously have observed in human islets of Langerhans, utilizing qPCR or RNA sequencing respectively [2, 6], where a significant increase in the MTNR1B mRNA in nondiabetic G/G risk allele carriers is evident. Regardless of this and of which cell line analyzed, MTNR1B expression was consistently very low, just above the level of detection. We then immunostained for C‐peptide and MTNR1B receptor protein in hiPSC derived β‐cells at Day 50 of differentiation (Figure 5J–L). C‐peptide staining was abundant (Figure 5J). MTNR1B staining appeared scattered to several C‐peptide negative cells (Figure 5K,L), as well as appearing in C‐peptide positive cells (Figure 5L merge—including enhanced image (5 L*).

MF002B2 hiPSC line, clonal selection andexpression. Edited nonrisk (C/C) and risk (G/G) clones were selected based on BsaXI restriction digestion genotyping (A). All clones with clear bands were selected (lower panel in A). At the end of differentiation, cells (bulk) were assessed for gene expression of(B) and(C) ( = 6, mean ± SD; each data point represents one individual differentiation experiment from each selected clone). (D, E) MTNR1B protein levels were assessed at the end of differentiation in bulk cells and presented as individual bars for each clone (D: white bars edited C/C clones and black bars, unedited G/G clones) as well as cumulatively (E) ( = 4–6, mean ± SD; each data point represents one individual differentiation experiment from each selected clone, ( > 0.05 was considered significant). MTNR1B INS MTNR1B N N p

expression in fully differentiated β‐cells. Images of GFP expression (green) in hiPSC and hESC derived β‐cells post lentivirus infection (A–C). Graphs show(D, F, H) and(E, G, I) expression in sorted GFP + β‐cells ( = 3, mean ± SD; each data point represents one individual differentiation experiment). Immunocytochemistry images show robust C‐Peptide+ cells (β‐cells, green) (J), MTNR1B (red) expression (K), with merge of the two stainings (L) and enhanced image displaying colocalization (L*). Scale bar represents 100 μm, and the images were captured at 10× magnification with a confocal microscope. MTNR1B INS MTNR1B N
Insulin Secretion From β‐Cells Derived From hiPSC and hESC
To determine functional changes in isogenic cell lines upon editing of the MTNR1B G‐risk allele, we exposed β‐cells (derived from both hiPSC and hESC) to either low (LG 1 mM) or high (HG 20 mM) glucose, and 3‐isobutyl‐1‐methylxanthine (IBMX 50 μM) with or without melatonin (100 nM) (Figure 6A–C; hiPSC derived β‐cells. D–F; hESC derived β‐cells.). Data are presented as fold secretion of glucose control (low glucose [LG]). Here, β‐cells derived from hiPSCs showed no response to glucose stimulation, while a robust stimulation was observed upon the addition of 50 μM IBMX (Figure 6A). These observations align with what most studies of such cells in vitro have reported [19, 20]. Similarly, no effects of high glucose were observed in hESC‐derived β‐cells, but a nominally increased secretory response occurred when cells were subjected to high glucose and IBMX (Figure 6D). The combination of high glucose and 100 nM melatonin nominally reduced insulin release in both hiPSC and hESC derived β‐cells (Figure 6B,E), where carriers of the G/G genotype appeared to be more sensitive to melatonin treatment (e.g., reduced secretion as compared to C‐allele carriers). Lastly, treatment with high glucose, IBMX and melatonin resulted in a nominal reduction in insulin release (Figure 6C,F). Again, this reduction appeared to be more prominent in β‐cells harboring the G/G risk as compared to the C/C nonrisk genotype. In summary, our secretion data suggest that β‐like cells derived from both hiPSCs and hESCs display a limited responsiveness to elevated glucose concentrations. Insulin secretion, however, is enhanced in the presence of IBMX, with no clear evidence for genotype‐dependent differences. However, there is an indication that β‐like cells carrying the G/G risk allele are more sensitive to the well‐known inhibitory effect of melatonin on insulin secretion; this observation requires further validation in larger datasets.
![Insulin secretion in differentiated cells. Fold secreted insulin (normalized to low glucose) in hiPSC derived β‐cells (A–C). Differences in fold (1 mM glucose (LG), 20 mM glucose (HG)) and HG + IBMX (50 μM) (A), stimulation with HG and melatonin (100 nM) (B). Stimulation with the combination of HG + IBMX (50 μM) + melatonin (100 nM) (C). Fold secreted insulin (normalized to low glucose) in hESC derived β‐cells (D–F). Differences in fold (1 mM glucose (LG), 20 mM glucose [HG]) and HG + IBMX (50 μM) (D), stimulation with HG and melatonin (100 nM) (E). Stimulation with the combination of HG + IBMX (50 μM) + melatonin (100 nM) (F). ( = 3 biological replicates, mean ± SD). N](https://europepmc.org/articles/PMC12405741/bin/JPI-77-e70073-g001.jpg "Click to view full size")
Insulin secretion in differentiated cells. Fold secreted insulin (normalized to low glucose) in hiPSC derived β‐cells (A–C). Differences in fold (1 mM glucose (LG), 20 mM glucose (HG)) and HG + IBMX (50 μM) (A), stimulation with HG and melatonin (100 nM) (B). Stimulation with the combination of HG + IBMX (50 μM) + melatonin (100 nM) (C). Fold secreted insulin (normalized to low glucose) in hESC derived β‐cells (D–F). Differences in fold (1 mM glucose (LG), 20 mM glucose [HG]) and HG + IBMX (50 μM) (D), stimulation with HG and melatonin (100 nM) (E). Stimulation with the combination of HG + IBMX (50 μM) + melatonin (100 nM) (F). ( = 3 biological replicates, mean ± SD). N
Discussion
Molecular mechanisms linked to genetic signals identified by GWAS could help elucidate the causes of β‐cell dysfunction in T2D. However, functional consequences of these signals in β‐cells remain unknown. Here, we describe a stem cell‐based approach, utilizing genome editing of hiPSC and hESCs followed by differentiation into β‐cells, with the aim to elucidate functional effects of risk alleles. To this end, we targeted the SNP rs10830963 mapping to an intron of the gene encoding the MTNR1B receptor, which is a robust risk allele for T2D [2, 6, 7, 8, 9].
We performed differentiation of hiPSC and hESC into β‐cells, utilizing a previously established 2D‐based protocol [16]. Both hiPSCs and hESCs differentiated accordingly, with the expected rising expression of endocrine markers, followed by increasing expression of INS and GCG at mRNA and protein levels during the later stages of differentiation, with INS expression being several fold higher at the termination of the differentiation in both hiPSCs and hESCs.
To allow disease modeling, we utilized CRISPR/Cas9 to perform single‐base genome editing of hiPSCs and hESCs. In hiPSCs, we edited the risk allele (G) to nonrisk (C) to generate isogenic cell lines, with genotypes G/G and C/C. Utilizing isogenic cell lines for comparison is essential as genetic heterogeneity between humans is considerable. Ideally, isogenic cell lines will differ only with regard to the edited SNP (from G to C). In addition, hESCs cells, which are heterozygous (C/G) at the rs10830963 locus, were edited to either the nonrisk (C/C) or risk (G/G) genotype. High efficiency ( > 90%) and fidelity (minimal indels) were achieved for all cell clones. Previous studies have shown limitations of the CRISPR/Cas9 system in its applicability due to, for example, low transfection efficiency, toxicity, difficulty in obtaining pure clones of edited cells, and off‐target effects [21]. However, here, no issues with editing were encountered.
We have previously shown that the MTNR1B rs10830963 SNP is an eQTL in human islets of Langerhans associated with increased MTNR1B mRNA levels [2]. To achieve this, evidence suggests that the SNP may influence MTNR1B gene expression via increased FOXA2‐bound enhancer activity in islet‐ and liver‐derived cells [14]. In addition to this, allele‐specific differences of the transcription factor NEUROD1 binding in islet‐derived cells have been observed [14]. This notwithstanding, demonstrating cellular or molecular proof of function of rs10830963 is critical, as it could merely act as a tag SNP in the haploblock, where additional SNPs are present, and may influence gene expression and cellular function, either separately or combined. Presently, causality of rs10830963 can only be determined by specifically editing this SNP in a relevant model and determine functional consequences thereof (i.e., prove that the SNP is an eQTL that increases MTNR1B expression in carriers of the G allele). Indeed, this may prove to be difficult, as the effect size of a single SNP may be relatively small, given that a plethora of genetic signals ( > 1000) associate with glycaemic traits and insulin secretion in T2D [4, 5].
To this end, mRNA expression of MTNR1B in risk (G/G) and nonrisk isogenic clones (both hiPSCs and hESCs) was determined. Overall, expression of MTNR1B was very low, both in sorted and unsorted β‐cells. This is a limitation of our study, as we are investigating potential functional effects of an eQTL. The reasons accounting for this low level of MTNR1B expression may be manyfold. One major reason for low MTNR1B expression may be inherent in our model—(e.g., stem cell derived β‐cells). Difficulties to detect and determine the expression of MTNR1B mRNA and protein in islet cells have previously been extensively discussed: studies utilizing global knock out mice of Mt1 and Mt2 reveal islet immunostaining of Mt2 protein localized to β‐cells, while Mt1 protein was observed in α‐cells [22]. MTNR1A and MTNR1B protein expression and abundance in human pancreatic β‐cells have been confirmed [2, 23, 24], but with lower MTNR1A and MTNR1B expression in α‐cells [24]. Others show MTNR1A mRNA expression predominantly in α‐cells of human islets, while MTNR1B expression were virtually undetectable [25]. The inherently low mRNA expression of MTNR1B in human islets has made it difficult to determine islet cell‐specific localization, even with recent efforts using single cell RNA sequencing [26]. In this context, studies on islet cell heterogeneity, genetic variation, metabolic state, half‐life and stability of the MTNR1B protein/mRNA may provide further insight. Interestingly, MTNR1B expression was readily detected in isolated human islets from both risk and nonrisk allele carriers, with a significant increase in expression in risk allele carriers [2], using qPCR or RNA sequencing [6]. Importantly, there is ample evidence that the common MTNR1B variants are associated with an increased risk of T2D [2, 6, 27, 28, 29, 30, 31]. However, low expression levels of MTNR1B mRNA in human pancreatic β‐cells have raised questions about the physiological relevance of melatonin signaling in these cells. Another suggestion is that timing of food intake to when melatonin levels are elevated (i.e., night) may impair glucose metabolism, particularly in MTNR1B G allele carriers [32], potentially via centrally mediated effects. Indeed, such an explanation could provide a mechanistic explanation for how circadian misalignment and genetic risk interact to increase T2D risk. It also underscores the metabolic importance of meal timing [33]. Disruption of both central and peripheral circadian rhythms—potentially due to rare, loss‐of‐function variants—may also contribute to the development of metabolic disorders, including T2D [34]. While several studies have consistently linked the common MTNR1B variant to metabolic traits, the association of rare, loss‐of‐function MTNR1B variants with T2D has also been shown [34, 35].
Of note here, we detected MTNR1B protein both in undifferentiated hiPSCs and hESCs and in differentiated β‐cells with Western blot and immunocytochemistry. These experiments were further validated with Western blot experiments in MTNR1B knockout hiPSCs, with results confirming significantly reduced abundance of MTNR1B protein. We detected MTNR1B protein in both undifferentiated hiPSCs and hESCs, as well as in differentiated β‐like cells, using Western blot and immunocytochemistry. To further assess the specificity of these signals, we performed additional Western blot analyses of hiPSCs in which the MTNR1B allele had been deleted by CRISPR/Cas‐editing: this revealed reduced abundance of MTNR1B protein reflecting the efficiency of MNTR1B knock out (45% vs. 26%; WB signal and knock out efficiency, respectively). Interestingly, the level of MTNR1B protein expression was nominally higher in β‐like cells derived from risk allele carriers, although this difference did not reach statistical significance (p = 0.09). This trend is consistent with the interpretation that the MTNR1B risk SNP (rs10830963) functions as an eQTL, under the assumption that increased mRNA levels are accompanied by a corresponding increase in protein levels. Given the modest sample size and the borderline statistical support, these observations should be interpreted with caution until confirmed in larger datasets from independent experiments.
Importantly, the effect size of a single SNP alteration may be obscured by numerous other genetic signals. Indeed, studies similar to ours, but of monogenic forms of diabetes (e.g., MODY), report functional changes. However, in these cases the effect size is profoundly greater [36, 37, 38]. This notwithstanding, linking common variants to disease mechanisms has major translational potential.
Consistent with other studies [19, 20], our stem cell derived β‐cells do not respond robustly in vitro to exogenously added glucose with increased insulin release. This notwithstanding, we observed that the addition of IBMX led to an increase in insulin release, with similar responses regardless of genotype. Under high‐glucose conditions, as well as in the presence of IBMX, melatonin nominally and modestly reduced insulin secretion in β‐cells derived from both hiPSCs and hESCs. This inhibitory effect appeared somewhat more pronounced in β‐like cells carrying the G/G genotype. These findings raise the possibility that β‐like cells carrying the G‐allele may exhibit a greater sensitivity to the inhibitory action of melatonin. If substantiated, such an effect would be consistent with the hypothesis that the rs10830963 SNP at the MTNR1B locus mediates an inhibition of insulin release, potentially explaining the diabetogenic influence of the G‐allele. However, given the preliminary nature of these data, derived from time‐consuming and labor‐intensive stem cell experiments, further and larger independent experiments are required to confirm this interpretation.
Importantly, melatonin has previously been shown to decrease insulin secretion, where acute effects of melatonin on insulin release are mediated by reduced formation of cAMP with a net inhibitory effect on insulin release [11, 12, 39]. Stimulation of β‐cells by glucose is known to increase intracellular cAMP, whereas melatonin blocks cAMP formation using various signaling pathways in clonal β‐cells, rodent and human islets [11, 12, 40, 41, 42]. Of note, stimulatory effects of melatonin on insulin secretion under certain conditions have also been reported, particularly following prolonged exposure in rodent islets [42] and human islets [25]. Besides the well‐known receptor mediated effects, melatonin can act as an antioxidant and reportedly reduces oxidative stress in β‐cells in vitro [43, 44].
It is established that stem cell derived β‐cells mature and function better in vivo, following transplantation into mice [20], while physiological responses in vitro are less robust. The reduced insulin secretory response of β‐cells derived from stem cells likely emanates from lack of humoral factors, and/or formation of a permissive niche, as well as of microvasculature, all of which are present in vivo during organogenesis, thereby promoting β‐cell maturation and function. Recently, however, several new protocols have been developed with improved yield and functionality of hiPSC‐derived β‐cells, utilizing 3D‐based approaches [45, 46, 47, 48]. Still, a certain degree of immaturity appears to be present in all stem‐cell derived β‐cells [20]. One reason for this was recently explored by metabolic profiling of stem cell derived β‐cells to determine their capacity to sense glucose [49]. Here, reduced anaplerotic cycling in the mitochondria was identified as a potential cause of reduced glucose‐stimulated insulin secretion. Importantly, insulin secretion could be recovered by challenging stem cell‐derived β‐cells with intermediate metabolites from the TCA cycle and late (but not early) glycolysis; this resulted in robust, bi‐phasic insulin release in vitro similar in magnitude to functionally mature human islets [49]. Another reason for the inability of hESC‐ and hiPSC‐derived β‐cells to respond to glucose may be that our and similar differentiation protocols yield polyhormonal cells (e.g., INS+ and GCG+ cells). Bruin et al., [50] have comprehensively characterized hESC‐derived bihormonal cells: they show that these cells are responsive to KCl and arginine, but not glucose, in perifusion studies. An explanation for loss of glucose sensing in these cells could be lack of GLUT1 protein and reduced KATP‐channel activity. Indeed, they report that the expression of the SUR1 subunit of the KATP‐channel was ~ fivefold lower than KIR6.2. Combined, this suggests that an impaired ratio of SUR1:KIR6.2 may contribute to the observed KATP‐channel defects in hESC‐derived islet endocrine cells, along with lack of GLUT1, which may underlie the absence of glucose‐stimulated insulin secretion. Indeed, we observed expression of GCG in our hESC‐ and hiPS‐derived β‐cells, albeit at several fold lower levels than that of INS.
It is clear that utilizing hiPSC as cellular systems to model disease mechanisms will become increasingly useful in biomedical research [51], including T2D research, where hiPSCs derived from humans could serve as versatile tools to understand disease mechanisms. There is strong evidence that the common MNTR1B variant (rs10830963) is associated with increased T2D risk [2, 6, 27, 28, 29, 30, 31, 52], and perturbed β‐cell function. Functional studies to determine the precise molecular mechanisms linking the MTNR1B variants to β‐cell dysfunction are therefore required. Our approach to understand the molecular underpinnings of the pathogenetic effects of the MTNR1B risk SNP was to evaluate functional outcomes in isogenic hiPSCs and hESCs carrying risk and nonrisk alleles. Our successful single‐base gene editing approach by CRISPR/Cas9 enabled functional studies of the MTNR1B risk allele. However, differentiation protocols need to be improved and further developed to increase maturity and yield of β‐cells. Here, 3D‐based protocols hold promise to generate islet cell‐like clusters, resembling primary tissue (human islets of Langerhans), to determine direct causality of T2D risk alleles on β‐cell function. Another limitation is that, at this point, the protocols for differentiation into β‐cells are extremely labor‐intensive: this restricts the number of cell preparations that can be generated for functional and expression studies, underpowering the experiments. This is a particular concern when T2D risk alleles are examined and which presumably possess small effect sizes.
Author Contributions
Study design and conceptualization was by M.F. and H.M., where P.W.F. supported this process. Experiments were performed by T.S., S.K., J.P.M.C.M.C., S.H., F.R., S.G., and A.S. K.Y.F. and O.E. biopsied patients. A.M. and H.S. guided the development of the differentiation protocol. A.R. manages the DIACT study and performed G.W.A.S. and genotyping of patients in the study. M.F. wrote the manuscript together with T.S., S.K., S.H. and F.R. All authors have read and approved the manuscript prior to submission.
Conflicts of Interest
The authors declare no conflicts of interest.