
What this is
- This research investigated the effects of () on growth performance, meat quality, and () deposition in finishing steers.
- Thirty Angus steers were divided into three groups and fed diets with varying levels over 240 days.
- Findings indicated that a 400 mg/kg diet improved growth metrics and meat quality, while the 800 mg/kg dose showed no significant benefits.
Essence
- Supplementation with 400 mg/kg significantly enhanced growth performance and meat quality in finishing steers, while 800 mg/kg had no notable effects.
Key takeaways
- 400 mg/kg supplementation increased final body weight and average daily gain of steers compared to the control group.
- Carcass weight and live weight before slaughter were significantly higher in the 400 mg/kg group, alongside reduced backfat thickness.
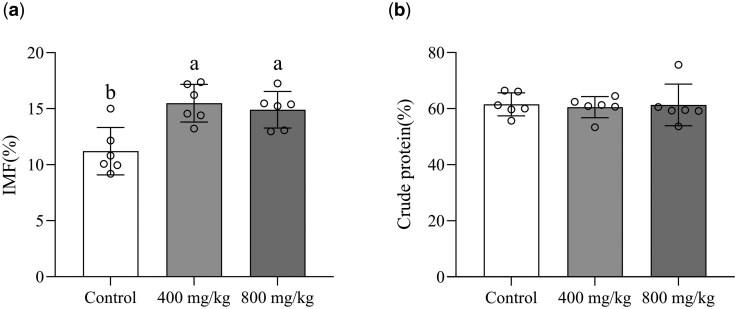
- Both doses improved content in the Longissimus lumborum muscle, with the 400 mg/kg group showing a content of 15.50% compared to 11.20% in the control.
Caveats
- The study was limited by a relatively small sample size of 30 steers, which may affect the generalizability of the findings.
- No significant effects were observed with 800 mg/kg , indicating a potential threshold effect for beneficial outcomes.
Definitions
- Intramuscular fat (IMF): Fat deposited within the muscle, contributing to meat tenderness and flavor.
- Resveratrol (RES): A natural polyphenolic compound found in various plants, known for its potential health benefits.
Simplified
Introduction
As a typical representative of high-end raw meat, marbled beef is highly favored by consumers due to its tenderness, juiciness, and unique aroma (). The marbling score is a key indicator for assessing intramuscular fat (IMF) content; a higher marbling score indicates greater IMF content and better beef grade (). However, IMF deposition in beef cattle is associated with prolonged feeding cycles and low feeding efficiency (). Therefore, improving IMF deposition efficiency and reducing feeding costs through nutritional regulation technologies have become key research focuses in this field. [Chang et al., 2022] [Schumacher et al., 2022] [Park et al., 2018]
Natural plant extracts have attracted significant attention for their efficacy in regulating lipid metabolism in livestock (). Resveratrol (RES), a natural polyphenolic plant extract, has been extensively studied for its role in regulating lipid metabolism (), enhancing the antioxidant capacity of livestock (), improving immune function (), and promoting intestinal health (). [Álvarez-Rodríguez et al., 2022] [Cheng et al., 2020] [Meng et al., 2018] [He et al., 2019] [Yang et al., 2021]
Some studies have shown that RES affects IMF deposition in livestock and poultry, but the findings across these studies are inconsistent (,;;). On the one hand, RES can promote IMF deposition. For example,revealed that dietary RES supplementation significantly promoted IMF deposition in the(LD) of finishing pigs, and this effect is related to the sirtuin 1-peroxisome proliferator-activated receptor gamma (SIRT1-PPARγ) signaling pathway.reported that adding RES to the diet of goats improved IMF content, although the specific mechanism remains unclear. On the contrary, some studies reported that RES had no effect on or inhibited IMF deposition.observed that IMF deposition in the LD muscle was not affected by RES supplementation in finishing pigs.found that the IMF content in the breast muscle of ducks decreased linearly with increasing RES addition. Therefore, the reported effects of RES on IMF deposition in livestock and poultry are controversial, and the underlying molecular mechanisms remain unclear. Moreover, no relevant studies have been conducted on beef cattle production. To fill this gap in the knowledge, we carried out this research on the application of RES in finishing cattle. We hypothesized that dietary RES supplementation would improve growth performance, enhance meat quality, and promote IMF deposition in finishing steers. [Zhang et al., 2015] 2019 [Jin et al., 2021] [Shen et al., 2022] [Zhang et al. (2019)] [Shen et al. (2022)] [Zhang et al. (2015)] [Jin et al. (2021)] longissimus dorsi
Materials and Methods
Animals, experimental design, and management
The animal experimentation protocol was ethically reviewed and authorized through the institutional oversight mechanism at Shandong Academy of Agricultural Sciences (SAAS-2024-067). Thirty healthy Angus steers (mean body weight of 571.83 ± 5.27 kg) raised on a commercial farm in Dezhou City, Shandong Province, China (36°24'N, 116°23'E) were selected for the trial. Prior to the experiment, all steers underwent a 15-d adaptation period. During this period, all steers were housed in individual pens and fed the uniform basal diet. The steers were then randomly allocated into three dietary treatment groups, with ten replicates in each group: a control group (basal diet) and two treatment groups, supplemented with either 400 or 800 mg/kg RES.
The basal diet was designed in compliance withguidelines to fulfill the nutrient requirements of beef cattle. The composition and nutrient content of the basal diets are shown in. Resveratrol was supplied by XI'AN Feida Bio-Tech Co., Ltd (Xi'an, China), with a 98.1% purity. The feeding experiment lasted 240 d. Throughout the experimental period, steers were housed in individual pens and fed twice daily at 07:00 and 17:00, withaccess to potable water. Final body weights were recorded at the termination of the experiment, and average daily gain was derived from the difference between initial and final body weight. Daily feed provision and residual quantities were systematically recorded to calculate dry matter daily intake. [NRC (2016)] Table 1 ad libitum
| Ingredient 1 | Content (%) | Nutrient level | Content (%) |
|---|---|---|---|
| Straw | 20 | Net energy for gain (MJ/kg) | 5.41 |
| Corn flakes | 55 | Crude protein | 12.67 |
| Soybean meal | 11 | Ether extract | 2.02 |
| Wheat bran | 10 | Neutral detergent fiber | 27.66 |
| Limestone | 0.8 | Acid detergent fiber | 13.04 |
| NaCl | 0.8 | Calcium | 0.4 |
| NaHCO3 | 1.6 | Phosphorus | 0.36 |
| Premix | 0.8 | ||
| Total | 100 |
Carcass measurements and sample collection
At the end of the experimental period, six steers per group were randomly selected and transferred to the abattoir (5 kilometers close from the farm) for slaughter. Following a 24-h fasting period, the animals were weighed before slaughter. Thereafter, the steers were exsanguinated via the aorta. After skinning and removing the head, hooves, tail, and visceral organs, the carcass weight was measured, and the dressing percentage was calculated. After skinning, IMF samples (approximately 10 g) were immediately collected from the left half-carcass between the 12th and 13th ribs using a circular drilled meat extractor (). The samples were then rinsed with phosphate-buffered saline (PBS), snap-frozen in liquid nitrogen, and stored at –80 °C for subsequent analysis of lipid metabolism enzyme activities, proteomic, transcriptomic, real-time quantitative PCR (RT-qPCR), and Western blotting. The left side of the carcass was then chilled at 4 °C for 72 h (). After chilling, the carcass was ribbed between the 12th and 13th ribs (). The subcutaneous backfat thickness at the 12th to 13th rib interface as measured at a point 3 cm from the midline using vernier calipers (). The eye muscle area was determined by outlining the cross-sectional contour of the(LL) muscle at the same location using transparent grid-ruled tracing paper (). Meat color and pH were measured on the exposed LL muscle surface. Finally, approximately 1,000 g of the LL muscle was carefully dissected, ensuring the exclusion of accessory muscles and subcutaneous fat (), and used for the measurement of meat quality and nutritional composition. [Yi et al., 2024] [Boles et al., 2005] [Bohrer et al., 2014] [Li et al., 2022] [Bodwell et al., 1959] [Luan et al., 2023] Longissimus lumborum
Meat quality and nutritional composition analysis
Muscle pH values and color parameters (L* lightness; a* redness; b* yellowness) were measured at 72 h postmortem. The pH meter was calibrated prior to each measurement series using pH 4.0 and 7.0 standard solutions under controlled conditions at 25 °C. Meat color was assessed by a colorimeter (NR20XE; 3nh Technology, Shenzhen, China), calibrated before use using the supplied white and black tiles. The instrument was configured using a D65 light source, a 10° standard observer, and a 20-mm aperture (the measurement was conducted on a freshly cut surface after blooming for 30 min at 4 °C) (). Both pH and color values were recorded in triplicate and averaged. [Bai et al., 2023]
To determine drip loss, muscle samples were trimmed into 2 × 2 × 4 cm strips (W1) along the myofiber orientation, vertically suspended in polyethylene bags, and stored at 4 °C. They were reweighed (W2) after 24 and 48 h of suspension. Drip loss was calculated as: Drip loss (%) = [(W1 – W2)/W1] × 100% (). [He et al., 2023]
To determine cooking loss, meat samples measuring approximately 4 × 5 × 2 cm were weighed (W3) (). All samples were cooked simultaneously in a single batch. Each sample was individually sealed in a heat-resistant vacuum bag to maintain its identity and integrity (). All bags were fully submerged in a water bath maintained at 80 °C. The core temperature of every sample was monitored in real-time using a digital thermometer (905-T1, Testo SE & Co. KGaA, Titisee-Neustadt, Germany), with the probe inserted into the center of the meat. Heating was continued until the core temperature reached 70 °C (). Subsequently, the samples were removed, cooled to ambient temperature, blotted dry on the surface, and reweighed (W4). Cooking loss was calculated as: cooking loss (%) = [(W3 – W4)/W3] × 100% (). [Jin et al., 2021] [He et al., 2023] [Yi et al., 2024] [Li et al., 2025]
For the shear force analysis, the samples were vacuum-packed and heated in an 80 °C water bath until they reached an internal temperature of 70 °C, followed by cooling to room temperature and storage at 2 ± 2 °C overnight (). From each sample, eight cylindrical cores (11 mm in diameter) were drilled parallel to the myofiber orientation using a coring device. The shear force was then determined using a texture analyzer (TA. XT Plus C; Stable Micro Systems, Surrey, UK) fitted with an HDP/WBV 60° angular probe (). The instrument settings were as follows: pre-test speed of 2.0 mm/s, test speed of 1.0 mm/s, post-test speed of 5.0 mm/s, and trigger force of 5 g. Each core was positioned so that the blade sheared perpendicularly to the myofiber orientation as 23.0 mm. The peak force (N) required to shear the core was recorded as the shear force value (). [Li et al., 2022] [Song et al., 2020] [Li et al., 2022]
Approximately 300 g of LL muscle was weighed and freeze-dried using a lyophilizer (SCIENTZ-18N; Ningbo Scientz Biotechnology Co., Ltd, Ningbo, China). The freeze-dried samples were first pulverized, and their crude protein content was determined accurately according to the common standard of Kjeldahl nitrogen determination. Briefly, 0.5 g of pulverized sample was mixed with 8 mL of concentrated HSO(98%), 1.2 g KSO, and 0.2 g CuSOand then digested in a digestion furnace until the solution was clarified. Thereafter, the digestate was transferred to a Kjeldahl nitrogen analyzer (Kjeltec 8400; FOSS, Hillerød, Denmark) to quantify the crude protein content on a dry matter basis (). The IMF content was measured using the Soxhlet extraction method. Briefly, freeze-dried and pulverized samples (0.5 g) were directly wrapped in filter paper. The filter paper package was placed in a Soxhlet extractor and extracted using anhydrous ether with a water bath temperature maintained at 45 °C for 6-7 h. After extraction, the samples were again oven-dried until a constant weight. The IMF content was calculated as the difference in weight before and after extraction as a percentage of the wet muscle tissue (). 2 4 2 4 4 [Benedict, 1987] [Zhang et al., 2019]
Lipid metabolic enzyme activity
A 2.5 g IMF sample was mixed with ice-cold physiological saline (4 °C) at a 1:9 mass-to-volume ratio. The mixture was homogenized for 15 s, followed by centrifugation at 4 °C and 12,000 × g for 10 min to isolate the supernatant. Enzyme-linked immunosorbent assay (ELISA) kits (Jiangsu Jingmei Biological Technology Co., Ltd) were employed to quantify the activities of lipid metabolic enzymes, including: fatty acid synthase (FAS; JM-08616B), acetyl-CoA carboxylase (ACC; JM-08593B1), stearoyl-CoA desaturase-1 (SCD1; JM-08596B1), adipose triglyceride lipase (ATGL; JM-08607B2), hormone-sensitive lipase (HSL; JM-08600B2), and carnitine palmitoyl transferase-1 (CPT-1; JM-08612B2). All assays were performed in strict accordance with the manufacturer's protocols. The total protein concentration was determined using a bicinchoninic acid (BCA) assay kit (CW0014S; CWBio, Jiangsu, China).
Transcriptomics and proteomics
Transcriptomic profiling and gene expression analysis
Approximately 100 mg of the IMF sample was collected for RNA extraction. Total RNA was then isolated via the TRIzol method. RNA integrity and quantity were evaluated with the Agilent 2100 Bioanalyzer (Agilent Technologies, Santa Clara, CA, USA). Qualified samples (1.5 μg RNA per group) were selected for sequencing. Enrichment of mRNA with oligo (dT) magnetic beads was followed by synthesis of double-stranded cDNA utilizing fragmented mRNA as a template. After end repair, A-tailing, and adapter ligation, cDNA libraries were constructed using PCR amplification. The library was checked for quality and sequenced using an Illumina NovaSeq 6000 platform (Illumina, San Diego, CA, USA). The sequencing data underwent filtration to eliminate low-quality reads and adapter sequences, obtaining clean reads. The HISAT2 software was employed to align sequences with the reference genome (version:). Differentially expressed genes (DEGs) were identified using a significance criterion of-value < 0.05 and |log(foldchange)| >1. Ensembl_100_bos_taurus_ars_ucd1_2_toplevel P 2
Proteomic profiling and protein abundance analysis
Following the method of, the samples stored at −80°C were ground with liquid nitrogen. The resulting material was then subjected to ice-cold lysis through agitation in SDS-Dithiothreitol-Tris buffer containing 100 mM NaCl. Subsequently, the lysate was centrifuged at 4 °C (12,000 rpm) to isolate the supernatant fraction. The supernatant was treated with iodoacetamide and incubated in the absence of light for 1 h. The mixture was then precipitated with pre-cooled acetone at −20°C for 2 h. After washing and drying, the proteins were dissolved in Dissolved buffer. Protein concentration was measured via the Bradford assay, with compliant samples adjusted to a final volume of 100 μL. Thereafter, trypsin and CaClwere added, and the mixture was incubated at 37 °C overnight. After adjusting the pH to < 3, the filtrate was collected by centrifugation and lyophilized. The Liquid Chromatography-Tandem Mass Spectrometry (LC-MS/MS) analysis was conducted on a Thermo Orbitrap Astral mass spectrometer. The mobile phases employed were solution A (aqueous 0.1% formic acid) and solution B (0.1% formic acid in acetonitrile). The ion source was operated at 1.9 kV and maintained at 290 °C. Proteins were identified and quantified using DIA-NN software based on the Bos_taurus_2023_10_18. Fasta (47,128 sequences) protein database with a false discovery rate (FDR) < 1% (). Differentially abundant proteins (DAPs) defined as proteins with< 0.05 and |log(foldchange)| > 0.263 (equivalent to fold change > 1.2, fold change < 0.83), were identified. [Kachuk et al. (2015)] [Demichev et al., 2020] 2 2 P
RNA isolation, reverse transcription, and RT-qPCR
For RNA extraction, frozen tissues were homogenized in a liquid nitrogen pre-chilled mortar with continuous liquid nitrogen replenishment during grinding. The resulting powder was transferred to RNase-free 2-mL microcentrifuge tubes. Total RNA was isolated using an Ultrapure RNA Kit (CWBio Biotech) following the manufacturer's protocol. The quantity and quality of RNA were confirmed via OD260/OD280 ratio measurements utilizing the ThermoFisher Technologies NanoDrop2000 instrument. First-strand cDNA was synthesized with HIScript II Q RT Super Mix (+gDNA wiper) (Vazyme, Nanjing, China). Quantitative PCR was performed on a Light Cycler 480 II system (Roche, Basel, Switzerland) using ChamQ SYBR Color qPCR Master Mix (Vazyme). Relative gene expression was normalized toand calculated using the 2method. The primers for quantitative polymerase chain reaction, designed and synthesized by Biosune (Shanghai, China), are detailed in. β-actin −ΔΔCt Table 2
| Gene 2 | Primer sequence (5′–3′) | Product size (bp) |
|---|---|---|
| β-actin | F: CACCGCAAATGCTTCTAGGC R: TGTCACCTTCACCGTTCCAG | 186 |
| FATP1 | F: TGATGGATGAGCTGGGCTAC R: TTTGCCCTCTACTCCTGGCA | 167 |
| CD36 | F: TTGGTGATGAGAAGGCGGA R: ACCAACACTGAGCAAGACG | 92 |
| FABP3 | F: AGTTCGATGAGACCACAGC R: TCAACCATCTCCCGCACAA | 124 |
| FABP4 | F: GTTTGAATGGGGGTGTGGT R: ACGATGCTCTTGACTTTCCT | 124 |
| PPARγ | F: CCTTCCAACTCCCTCATGGC R: CCGGAAGAAACCCTTGCATC | 105 |
| RXRα | F: TCGGTCATCAGTTCCCCCAT R: TTGGTGAAGGACGCCATGTT | 200 |
| FAS | F: GTGGGCTTGGTGAACTGTCT R: AGGACTTCGGGTCTGTCTCA | 112 |
| ACC | F: TCGACCTGCTGGAGGAGAA R: GTAAGGCCAGACCATCCTGG | 105 |
| GK | F: AAATCTCTCATAGCCCGAAA R: GACTGGTCTCCCAAACACC | 70 |
| DGAT1 | F: TGTCACTCATCATCGGGCAG R: CTCACGGTTGAGCACGTAGT | 71 |
| AGPAT1 | F: CGTTGTCTCCAACCACCAGA R: GCGACCTCAGACATGACACT | 192 |
Western blotting analysis
Total and nuclear proteins were extracted using radioimmunoprecipitation assay buffer (Beyotime, Shanghai, China) following the manufacturer's protocol. Protein concentrations were determined using a BCA assay kit (P0010; Beyotime). Following electrophoresis of equal protein quantities via SDS-PAGE, the samples were transferred to polyvinylidene fluoride membranes (ISEQ00010; Millipore, Billerica, MA, USA). The membranes were then blocked using 5% skimmed milk for 1 h before being incubated overnight at 4 °C with the specified primary antibodies: anti-fatty acid transport protein 1 (FATP1) (CQA5932; Cohesion Biosciences Limited, Suzhou, China), anti-fatty acid-binding protein 3 (FABP3) (10676-1-AP; Proteintech, Wuhan, China), anti-FABP4 (12802-1-AP; Proteintech), anti-ACC (bs-11912R; Bioss Biotechnology, Beijing, China), anti-diacylglycerol O-acyltransferase 1 (DGAT1) (CQA3228; Cohesion Biosciences Limited), and anti-GAPDH (60004-1-lg; Proteintech). Following three washes with TBST buffer (containing 0.05 M Tris, 0.15 M NaCl, and 0.1% Tween-20), the blots were incubated with secondary goat anti-rabbit or goat anti-mouse secondary antibodies (A0216/A0208; Beyotime) at room temperature for 2 h. After three additional TBST washes, the protein bands were visualized using an enhanced chemiluminescence (ECL) substrate (180-5001; Tanon Science & Technology Co., Ltd, Shanghai, China) and detected using a chemiluminescence imaging system (Tanon 5200; Tanon Science & Technology Co., Ltd). Band intensity was quantified using Quantity One software (Bio-Rad Laboratories, Hercules, CA, USA).
Statistical analysis
Following initial data collation, statistical analysis was performed using R programming language (v4.2.1; R Foundation for Statistical Computing, Vienna, Austria). One-way ANOVA was performed to assess the dietary treatments (fixed effect) on the differences in growth and carcass traits, meat quality, conventional nutritional components of the LL muscle, and lipid metabolic enzyme activities of finishing steers. All data are reported as the means with the standard error of the mean (SEM) in a separate column, and-value of less than 0.05 denotes statistical significance. Gene and protein expression data were analyzed using an independent two-sample-test and visualized as bar graphs using GraphPad Prism (v10.4.1; GraphPad Software, La Jolla, CA, USA). P t
Bioinformatics analysis was conducted using the R programming language. Transcriptomic data underwent differential gene expression analysis using the DESeq2 (v1.20.0) package, while proteomic data were subjected to differential protein abundance analysis employing Student's-test. Kyoto Encyclopedia of Genes and Genomes (KEGG) pathway enrichment was determined via the "clusterProfiler" package, and the results were visualized as bubble plots. Additional visualizations included volcano plots (generated using "ggplot2") and heat maps (constructed using "pheatmap"). t
Results
Effect of dietary RES on growth performance in finishing steers
As shown in, there were no differences (> 0.05) in dry matter daily intake of finishing steers across all groups. Compared to the control group, the steers in the 400 mg/kg RES group exhibited a significant increase in final body weight and average daily gain (< 0.05), whereas no significant effect was observed in the 800 mg/kg RES group (> 0.05). Table 3 P P P
| Items 3 | Treatments | SEM | -valueP | ||
|---|---|---|---|---|---|
| Control | 400 mg/kg | 800 mg/kg | |||
| Initial body weight, kg | 570.3 | 574.1 | 571.1 | 5.27 | 0.956 |
| Final body weight, kg | 726.5b | 753.4a | 735.2a,b | 4.49 | 0.038 |
| Average daily gain, kg | 0.65b | 0.75a | 0.68a,b | 0.01 | 0.016 |
| Dry matter daily intake, kg | 10.94 | 10.94 | 10.94 | 0.2 | 0.999 |
Effect of dietary RES on carcass traits in finishing steers
As shown in, varying RES supplementation levels demonstrated no impact (> 0.05) on dressing percentage and eye muscle area across all experimental groups of finishing steers. Compared to the control group, the steers in the 400 mg/kg RES group exhibited a significant increase in live weight before slaughter and carcass weight (< 0.05), while also showing a significant decrease in subcutaneous backfat thickness (< 0.05). No significant effect on carcass traits was detected in the 800 mg/kg RES group (> 0.05). Table 4 P P P P
| Items 5 | Treatments | SEM | -valueP | ||
|---|---|---|---|---|---|
| Control | 400 mg/kg | 800 mg/kg | |||
| Live weight before slaughter, kg | 703.67b | 731.17a | 714.83a,b | 4.47 | 0.029 |
| Carcass weight, kg | 454.97b | 481.83a | 467.8a,b | 4.58 | 0.046 |
| Dressing percentage, % | 64.64 | 65.9 | 65.49 | 0.52 | 0.628 |
| Eye muscle area, cm2 | 92.46 | 94.43 | 93.54 | 0.81 | 0.64 |
| Subcutaneous backfat thickness, cm | 2.39a | 2.12b | 2.26a,b | 0.05 | 0.048 |
Effect of dietary RES on meat quality and nutrient composition of LL muscle in finishing steers
As shown in, there were no differences (> 0.05) in pH and meat color of the LL muscle among the groups. However, both the 400 and 800 mg/kg RES groups exhibited lower drip loss, cooking losses and shear force in the LL muscle compared to the control group (< 0.05). While crude protein content showed no intergroup variation (,> 0.05), the IMF content in the 400 mg/kg RES (15.50%) and 800 mg/kg RES (14.90%) groups was increased compared to the control (11.20%,< 0.05). Table 5 Figure 1 P P P P

Effects of dietary resveratrol on intramuscular fat (a) and crude protein (b) in themuscle of finishing steers. Different lowercase letters above the bars indicate statistically significant differences between groups (< 0.05). Eighteen animals were used. Results are presented as mean, with SEM listed separately ( = 6 biological replicates). IMF, intramuscular fat; Control, basal diet; 400 mg/kg, basal diet supplemented with 400 mg/kg resveratrol; 800 mg/kg, basal diet supplemented with 800 mg/kg resveratrol. Longissimus lumborum P n
| Items 7 | Treatments | SEM | -valueP | ||
|---|---|---|---|---|---|
| Control | 400 mg/kg | 800 mg/kg | |||
| pH72 h | 5.79 | 5.81 | 5.71 | 0.03 | 0.459 |
| L*72h | 43.15 | 41.57 | 43.04 | 0.66 | 0.575 |
| a*72h | 26.13 | 26.19 | 25.07 | 0.32 | 0.294 |
| b*72h | 13.42 | 11.97 | 11.97 | 0.44 | 0.318 |
| Drip loss(%)24h | 4.34a | 3.94b | 3.76b | 0.09 | 0.018 |
| Drip loss(%)48h | 7.3a | 6.72b | 6.54b | 0.11 | 0.004 |
| Cooking loss (%) | 26.7a | 23.57b | 24.93b | 0.42 | 0.003 |
| Shear force (N) | 58.26a | 48.5b | 50.12b | 1.49 | 0.007 |
Effect of dietary RES on lipid metabolic enzyme activity of IMF in finishing steers
The adipose triglyceride lipase (ATGL) and hormone-sensitive lipase (HSL) activities in the LL muscle were lower in the 400 mg/kg RES group than in the control group (< 0.05), while no significant effects were observed in the 800 mg/kg RES group (> 0.05;). Conversely, acetyl-CoA carboxylase (ACC) activity in the RES groups was higher (< 0.05) than in the control. No significant variations were observed in fatty acid synthase (FAS), stearoyl-CoA desaturase-1 (SCD1) and carnitine palmitoyl transferase-1 (CPT-1) enzyme activities within the LL muscle among the other groups (> 0.05). P P P P Table 6
| Items 9 | Treatments | SEM | valueP- | ||
|---|---|---|---|---|---|
| Control | 400 mg/kg | 800 mg/kg | |||
| FAS, nmol/g prot | 0.29 | 0.27 | 0.32 | 0.01 | 0.099 |
| ACC, ng/mg prot | 0.27b | 0.31a | 0.32a | 0.01 | 0.015 |
| SCD1, pg/mg prot | 34.55 | 33.03 | 32.92 | 0.37 | 0.135 |
| ATGL, ng/mg prot | 5.02a | 3.92b | 4.32a,b | 0.17 | 0.015 |
| HSL, ng/mg prot | 0.72a | 0.55b | 0.76a | 0.03 | <0.001 |
| CPT-1, pg/mg prot | 29.31 | 25.68 | 25.65 | 0.87 | 0.145 |
Transcriptomics and proteomics
To clarify the mechanism by which RES promoted IMF deposition in the LL muscle of finishing steers, control and 400 mg/kg RES groups were selected for subsequent testing based on the significant differences in IMF content and lipid metabolic enzyme activity. The control group was labeled as IMF, and the 400 mg/kg RES group was labeled as IMF_RES.
Identification and comparison of DEGs
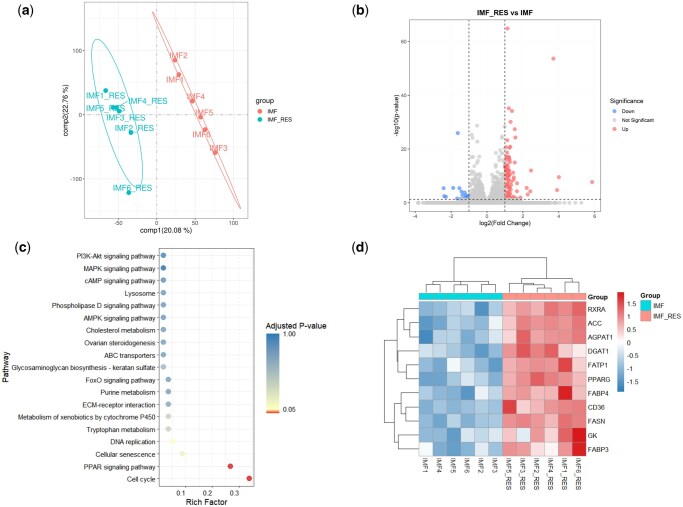
After performing quality control of all original sequencing reads, a total of 78.5 GB of clean reads were obtained, with the average sequencing quality indicator Q30 being 97.6%. Reference genome alignment results showed that the IMF tissue transcriptome had an average genome mapping rate of 93.7%, including 91.5% unique and 2.2% multiple mapping rates (). Principal component analysis (PCA) revealed a distinct separation between the IMF_RES and IMF groups (). RNA-seq analysis identified 18,842 genes, including 120 DEGs, of which 100 were upregulated and 20 were downregulated (). Kyoto encyclopedia of genes and genomes enrichment analysis showed significant enrichment of DEGs in the PPAR signaling pathway and cell cycle (). The PPAR signaling pathway is associated with lipid metabolism. Within this pathway, 11 DEGs exhibiting close associations with lipid metabolism were identified ():, cluster of differentiation 36 (),, andwere involved in fatty acid uptake and transport, while, retinoid X receptor alpha (),,, glycerol kinase (),, and 1-acylglycerol-3-phosphate O-acyltransferase 1 () participated in lipid synthesis. Supplementary Table S1 Figure 2a Figure 2b Figure 2c Figure 2d FATP1 CD36 FABP3 FABP4 PPARγ RXRα ACC FASN GK DGAT1 AGPAT1

Differentially expressed genes between IMF_RES and IMF groups. (a) Principal component analysis. (b) Volcano plot of DEGs. (c) KEGG enrichment analysis of DEGs. (d) Cluster heatmap of 11 lipid metabolism-related DEGs in the PPAR signaling pathway. DEGs, differentially expressed genes; KEGG, Kyoto Encyclopedia of Genes and Genomes. IMF_RES, 400 mg/kg resveratrol group; IMF, basal diet group; RXRA, retinoid X receptor alpha; ACC, acetyl-CoA carboxylase; AGPAT1, 1-acylglycerol-3-phosphate O-acyltransferase 1; DGAT1, diacylglycerol O-acyltransferase 1; FATP1, fatty acid transport protein 1; PPARG, peroxisome proliferator-activated receptor gamma; FABP4, fatty acid-binding protein 4; CD36, cluster of differentiation 36; FASN, fatty acid synthase; GK, glycerol kinase; FABP3, fatty acid-binding protein 3.
Identification and comparison of DAPs
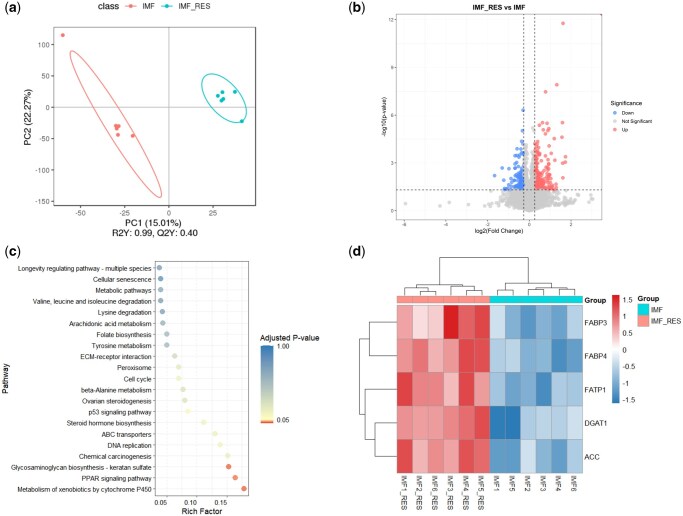
Proteomic analysis revealed high peptide specificity and stable reproducibility of indexed retention time (iRT) values. These peptides were mapped to 9,540 proteins, and subcellular localization analysis revealed 33.6% nuclear proteins, 16.8% cytoplasmic proteins, and 6.6% mitochondrial proteins (). PCA revealed a distinct separation between the IMF_RES and IMF groups (). Further analysis identified 372 DAPs, including 249 upregulated and 123 downregulated DAPs (). The KEGG pathway analysis revealed that DAPs were significantly enriched in three key pathways: xenobiotics by cytochrome P450, the PPAR signaling pathway, and glycosaminoglycan biosynthesis-keratan sulfate, with the lipid metabolism-related pathway being the PPAR signaling pathway (). Within the PPAR pathway, 5 DAPs closely associated with lipid metabolism were identified (): FATP1, FABP3, and FABP4 participate in fatty acid uptake and transport, while ACC and DGAT1 are involved in lipid synthesis. Supplementary Figure S1 Figure 3a Figure 3b Figure 3c Figure 3d

Differentially abundant proteins between IMF_RES and IMF groups. (a) Principal component analysis. (b) Volcano plot of DAPs. (c) KEGG enrichment analysis of DAPs. (d) Cluster heatmap of 5 lipid metabolism-related DAPs in the PPAR signaling pathway. DAPs, differentially abundant proteins; KEGG, Kyoto Encyclopedia of Genes and Genomes. IMF_RES, 400 mg/kg resveratrol group; IMF, basal diet group; FABP3, fatty acid-binding protein 3; FABP4, fatty acid-binding protein 4; FATP1, fatty acid transport protein 1; DGAT1, diacylglycerol O-acyltransferase 1; ACC, acetyl-CoA carboxylase.
Effects of RES on mRNA and protein expression of lipid metabolism regulatory factors in the PPAR signaling pathway
To further validate the transcriptional levels and protein expression of lipid metabolism-related factors within the PPAR signaling pathway based on the aforementioned experimental results, RT-qPCR analysis was conducted (). The results demonstrated that the mRNA expression levels of,,,,,,, andin the LL muscle of RES-treated finishing steers were upregulated compared with those in the control group (< 0.05). In contrast, no significant intergroup differences were observed in the mRNA expression levels of other genes associated with lipid metabolism (> 0.05). Western blotting analysis () demonstrated elevated protein expression levels of FATP1, FABP3, FABP4, ACC, and DGAT1 in the LL muscle of the RES group compared to the control group (< 0.05). No significant differences were observed in the expression levels of other proteins between the experimental groups (> 0.05). Figure 4a and d Figure 4b, c, e, and f PPARγ FATP1 FABP3 FABP4 ACC FAS GK DGAT1 P P P P

Effects of dietary resveratrol supplementation on mRNA levels (a, d) and protein abundance (b, c, e, f) of lipid metabolism-related genes in the intramuscular fat of finishing steers. Data are presented as mean ± S.E. Different lowercase letters above the bars indicate statistically significant differences between groups (< 0.05). RES, resveratrol; IMF, basal diet group; IMF_RES, 400 mg/kg resveratrol group. FATP1, fatty acid transport protein 1; CD36, cluster of differentiation 36; FABP3, fatty acid-binding protein 3; FABP4, fatty acid-binding protein 4; PPARγ, peroxisome proliferator-activated receptor gamma; RXRα, retinoid X receptor alpha; ACC, acetyl-CoA carboxylase; FASN, fatty acid synthase; GK, glycerol kinase; DGAT1, diacylglycerol O-acyltransferase 1; AGPAT1, 1-acylglycerol-3-phosphate O-acyltransferase 1. P
Discussion
Effect of dietary RES on growth performance and carcass traits in finishing steers
Dietary supplementation with 400 mg/kg RES significantly increased the average daily gain and final body weight of steers. However, increasing the dosage to 800 mg/kg had no significant effect on the average daily gain. A similar dose-response relationship was observed by, who reported that supplementing the diet of Nubian goats with 150 mg/kg RES significantly increased average daily gain, whereas increasing the dose to 300 mg/kg resulted in a nonsignificant effect. The improvement in average daily gain in the low-dose group may be associated with an increased abundance of beneficial rumen microbes involved in short-chain fatty acid production (). However, the lack of a significant effect in the high-dose group may be attributed to the inhibition of ruminal microbial growth and fermentation function by high concentrations of phenolic compounds (). Regarding carcass traits, dietary supplementation with 400 mg/kg RES significantly increased the live weight before slaughter and carcass weight of beef cattle while reducing backfat thickness. However, when the RES dosage was increased to 800 mg/kg, no significant differences were observed in all carcass traits indicators compared to the control group. The improvement in live weight before slaughter and carcass weights is primarily associated with improved growth performance and the reduction of backfat thickness is mainly due to the role of RES in promoting lipolysis in subcutaneous fat (). However, the elevated dosage of 800 mg/kg shows decreased effectiveness. These results indicate that 400 mg/kg of RES appears to be the ideal dosage. Therefore, this study establishes that dietary 400 mg/kg RES effectively improves average daily gain, carcass weight, and subcutaneous fat thickness in finishing steers, providing a scientific basis for its application in beef cattle production. [Shen et al. (2022)] [Shen et al., 2022] [Yang et al., 2010] [Zhang et al., 2015]
Effect of dietary RES on meat quality and nutrient composition of LL muscle in finishing steers
Water-holding capacity is a critical quality attribute of muscle tissue. Drip and cooking losses are key evaluation parameters closely associated with both IMF, water content, and ease of water migration from the myofibrillar network (). Existing research indicates that dietary RES supplementation can improve meat color in the finishing pig LD muscle while simultaneously enhancing muscle water-holding capacity (). In the current study, the addition of RES to the diet did not affect muscle pH or color characteristics of finishing steers. However, it reduced both drip and cooking losses. Previous studies have demonstrated that RES enhances muscle antioxidant capacity and inhibits lipid oxidation (;). Therefore, the increased water-holding capacity of the LL muscle observed in the present study might be related to RES increasing antioxidant capacity. Shear force serves as a critical objective indicator for evaluating beef tenderness and overall eating quality (). Published studies have reported a range of shear force values from approximately 39.70 N to 82.1 N in the LL muscle of Angus cattle (;;). The shear force values obtained in the present study (48.50 N to 58.26 N) are within this range. This study found that RES significantly reduced the shear force value in the LL muscle of steers while significantly elevating IMF content. Muscle shear force is typically negatively correlated with IMF content (). This indicates that the improvement in beef tenderness is primarily associated with RES promoting IMF deposition. In the subsequent discussion, we focused on elucidating the regulatory effects and underlying mechanisms by which RES influences IMF deposition. [Oswell et al., 2021] [Zhang et al., 2019] [Meng et al., 2020] [Cui et al., 2023] [Martinez et al., 2023] [Tayengwa et al., 2020] [Bai et al., 2023] [Liu et al., 2024] [Shen et al., 2022]
Effect of dietary RES on lipid metabolic enzyme activity of IMF in finishing steers
This study demonstrated that dietary RES supplementation in finishing steers enhanced the activity of the lipogenic enzyme ACC while suppressing the activities of lipolytic enzymes ATGL and HSL in the IMF. During lipogenesis, ACC catalyzes the conversion of acetyl-CoA to malonyl-CoA, providing an essential substrate forsynthesis, thereby significantly enhancing the rate of fatty acid synthesis (). ATGL and HSL, rate-limiting enzymes in triglyceride hydrolysis during lipolysis, promote fat mobilization by cleaving triglycerides into free fatty acids, thereby reducing lipid accumulation (). The present study demonstrated that RES modulated the activity of lipid-metabolizing enzymes, thereby enhancing lipogenesis while suppressing lipolysis, consequently increasing the IMF content. de novo [Zhang et al., 2024] [Lasa et al., 2012]
Effect of dietary RES on the expression of genes and proteins related to IMF deposition in finishing steers
The PPAR signaling pathway is a key lipid metabolism pathway that regulates lipid metabolism in the body through ketogenesis, lipid transport, lipogenesis, cholesterol metabolism, fatty acid transport, and fatty acid oxidation (). In the current study, multi-omics analysis revealed that 11 DEGs and 5 DAPs, predominantly enriched in the PPAR signaling pathway, were closely associated with fatty acid uptake, transport, and lipogenesis. These findings suggest that RES regulates lipid metabolism primarily by activating the PPAR signaling pathway, thereby promoting IMF deposition in the LL muscle of finishing steers. [Michalik et al., 2008]
Regarding fatty acid uptake and transport, integrated multi-omics and experimental validation demonstrated upregulated expression of FATP1, FABP3, and FABP4 within the IMF of LL muscle from RES-supplemented steers, in line with prior research findings (;). FATP1, FABP3, and FABP4 are the key factors involved in fatty acid transmembrane transport within the PPAR signaling pathway. FATP1, a crucial transmembrane transporter that mediates long-chain fatty acid uptake, significantly enhances fatty acid absorption in muscle tissues when its expression is elevated (). FABP3 and FABP4 mainly bind to intracellular free fatty acids and promote their transport to lipid droplets (). Therefore, we hypothesized that RES promotes IMF deposition, in part, by enhancing fatty acid uptake and transport. [Sun et al., 2019] [Wu et al., 2020] [Zhong et al., 2024] [Wang et al., 2023]
For fat synthesis, transcriptomics and RT-qPCR validation showed that the levels of,,,, andwere significantly increased in the RES group. Proteomics and western blotting validation revealed significantly elevated expression of ACC and DGAT1. PPARγ is a key regulator of IMF deposition. It forms heterodimers with RXRα that recognize and bind to specific DNA sequences, thereby activating downstream adipogenic gene expression (). FAS is a key rate-limiting enzyme in the long-chain fatty acid synthesis pathway that utilizes malonyl-CoA generated by ACC catalysis for fatty acid synthesis (;). GK catalyzes the generation of glycerol-3-phosphate from glycerol, providing a basic backbone for triglyceride synthesis (). DGAT1 catalyzes the formation of triglycerides from fatty acids and glycerol, thereby promoting lipid droplet formation (). Thus, the mechanism of action of RES in promoting IMF deposition is, in part, through the modulation of the expression of PPARγ and its downstream lipid synthesis factors. PPARγ ACC FAS GK DGAT1 [Lefebvre et al., 2010] [Witkowski et al., 2007] [Huh & Saltiel, 2021] [Miao et al., 2019] [Guo et al., 2023]
Conclusion
The addition of 400 mg/kg RES to the diet of finishing steers improved growth performance and carcass traits, while enhancing the muscle quality of the LL muscle and significantly increasing the IMF content. Multi-omics analysis and validation results demonstrated that the PPAR signaling pathway is a key pathway through which RES promotes IMF deposition, primarily by enhancing fatty acid uptake and transport, as well as fat synthesis. This study provides a theoretical basis for promoting IMF deposition of finishing steers and improving beef quality. It should be noted that this study was limited by the relatively small sample size. Therefore, further studies with larger sample sizes are warranted to validate these findings.