
What this is
- This research investigates the roles of p21 and p16 in cellular senescence across human and mouse aging tissues.
- Using single-cell RNA sequencing, the study reveals distinct populations of p21+ and p16+ cells with unique secretory profiles.
- The findings emphasize the heterogeneity of senescent cells and their (), which varies by tissue type.
Essence
- p21+ and p16+ cells represent distinct populations in aging tissues, each with unique secretory profiles. The study underscores the complexity of cellular senescence, revealing that these markers do not co-express and follow independent developmental trajectories.
Key takeaways
- Distinct subpopulations of p21+ and p16+ cells exist in aging tissues, each exhibiting unique profiles. These populations do not transition into one another, indicating separate functional roles.
- The study identifies a limited set of shared 'core' factors that may drive common senescence-related functions, despite the overall diversity in secretory profiles.
- Tissue-specific variations in the expression of p21 and p16 highlight the complexity of senescence, suggesting that therapeutic approaches targeting senescent cells must consider these differences.
Caveats
- The reliance on single-cell RNA sequencing may introduce technical biases, such as drop-out effects, potentially overlooking important components of the senescence phenotype.
- The study does not address heterogeneity using spatial proteomics, indicating a need for broader analyses in future work to fully understand the functional specialization of senescent cells.
Definitions
- senescence-associated secretory phenotype (SASP): A collection of secreted factors by senescent cells, including cytokines and growth factors, that influence surrounding tissue environments.
Simplified
Introduction
Cellular senescence is characterized by not just an irreversible cell-cycle arrest but also the development of various functional and morphological alterations in distinct cell compartments, such as the nucleus, lysosomes, mitochondria, and others (Gorgoulis et al, 2019; Hayflick and Moorhead, 1961). The senescence-associated cell-cycle arrest is primarily mediated by cyclin-dependent kinase inhibitors (CDKis), notably p21CIP1 and p16INK4A. For simplicity, we refer to the gene transcripts as p21 and p16, and to the proteins as p21 and p16, respectively (Gorgoulis et al, 2019). Although p27 has been reported in skin (Liu et al, 2015) and fibroblasts (Wagner et al, 2001), and p19 in the brain (Dehkordi et al, 2021), these are not universally involved in senescence. Yet, current guidelines by the senescence research community prioritize p21 and p16 as key CDKi for senescence characterization (Ogrodnik et al, 2024; Suryadevara et al, 2024). Senescent cells also exhibit a senescence-associated secretory phenotype (SASP), which consists of a diverse array of secreted factors including immune-modulatory cytokines and chemokines, matrix remodeling enzymes, and growth factors (Coppé et al, 2008). Senescent cells play crucial roles in development, tumor suppression, and tissue repair (Demaria et al, 2014; Muñoz-Espín et al, 2013; Serrano et al, 1997). However, as individuals age, the accumulation of these cells has been linked to the onset of various age-related conditions. Additionally, in mice, the removal of senescent cells either genetically or pharmacologically prevents the development of age-related adverse outcomes, underscoring the therapeutic potential of targeting these cells (Robbins et al, 2021).
Even though there are numerous molecular changes associated with senescent cells, detecting these cells within tissues remains exceedingly challenging. Central to this difficulty is the absence of a singular specific marker for the unequivocal identification of senescent cells, as none of the markers conventionally employed in senescence detection exhibit individual specificity. Adding to this complexity, senescent cells and their SASP exhibit variability contingent upon the specific physiological context, stress, cell type, and tissue under investigation (Hernandez-Segura et al, 2017).
The recent advancements in single-cell omics technologies offer a unique opportunity to comprehensively unravel the heterogeneity of the senescent phenotype across various cell types and tissues (Gurkar et al, 2023). One of the key unresolved questions concerns the relative contributions of p16 and p21, which have been identified as critical drivers of cellular senescence, towards age-related senescence across different tissues in vivo. By analyzing multiple in vivo scRNA-seq datasets—including Tabula Muris Senis (Almanzar et al, 2020) and the Calico murine aging cell atlas (Kimmel et al, 2019)—across diverse murine tissues (brain, skeletal muscle, bone, and liver) as well as human skin and lung during aging, we found that p16 and p21 expression arises in tissue-specific cell populations. These populations display unique, often non-overlapping secretory profiles, suggesting that they play distinct functional roles.
Furthermore, our findings indicate that while there are commonalities in SASP profiles in p16 and p21 expressing cells, these vary considerably according to tissue- and cell-type. In addition, we find that a small number of common SASP markers can be considered as a "core" set associated with cellular senescence. Our comprehensive analysis underscores the intricate nature of cellular senescence and the associated secretory profile, emphasizing the important role of single-cell studies to fully elucidating and characterizing senescence in aging tissues.
Results
Unraveling the p16- vs. p21-associated secretome in the murine brain
Our further analysis revealed the presence of three subpopulations: (1) cells exclusively expressing p21; (2) cells exclusively expressing p16; and (3) cells expressing both p21 and p16 (Fig. 1C,D). The unbiased trajectory analysis using scVelo and PhyloVelo (describing the rate of gene expression change at a given time point) showed that p21+ and p16+ cells do not share a common developmental pathway, indicating that neither cell type arises from the other. This suggests that these populations are distinct and do not transition into one another (Wang et al, 2024b) (Fig. 1E). To gain deeper insights into the composition of the associated secretome within these identified subpopulations, we leveraged our previously established SenMayo gene set (Saul et al, 2022), which has been demonstrated to be commonly regulated across various age-related transcriptome datasets and is primarily composed of SASP-related factors (Brizio et al, 2024; Carapeto et al, 2024; Suryadevara et al, 2024). Interestingly, the variability of expressed SASP factors among p16+ cells was substantially higher, as demonstrated by their standard error, compared to that of p21+ cells. This suggests that the secretory phenotype in p21+ cells may be a more conserved or consistent mechanism—or that p21+ cells are more homogeneous (Fig. 1F). We observed a distinct secretory profile for p21+ and p16+ cells, marked by limited overlap between the two populations. Notably, only two genes, Cxcl16 and Plaur, were expressed in both subpopulations (Fig. 1G). Likewise, an expanded analysis of 1989 secreted protein genes (as listed by the Human Protein Atlas (Uhlén et al, 2015)), which included the secreted proteins plus SenMayo, revealed limited overlap between p21+ and p16+ cells. Only four genes, Col8a2, Plaur, Cxcl16 and Fbln5 were shared between the two subpopulations (Fig. EV1C). To eliminate potential cell type-specific biases between p21+ and p16+ cells, we focused on microglia and oligodendrocytes, as these represent the cell types with the highest proportion of p21+ and p16+ cells (Fig. 1B). We found that p21+ and p16+ microglia or oligodendrocytes had distinct secretory profiles, with only partial overlap in microglia, mirroring the differences seen in the overall population. This suggests that these variations are primarily driven by p16 or p21 expression rather than intrinsic cell type differences (Fig. EV1D,E). To further explore the differences between p21+ and p16+ cells and refine the RNA velocity analysis, we conducted a biased pseudotime analysis using Monocle3 (Cao et al, 2019), following the initial unbiased PhyloVelo approach. This allowed us to trace the dynamic trajectories of these subpopulations within the brain dataset, providing a more detailed understanding of their developmental pathways. Surprisingly, the results showed that the trajectory dynamics were independent of p16 or p21 expression status, with no evidence of direct lineage progression from p16+ to p21+ cells (Fig. EV1F,G).
To validate our initial observations, we analyzed an independent brain dataset from eight young and eight old whole mouse brains (excluding hindbrain (Ximerakis et al, 2019)). As observed in the first dataset, p21+ and p16+ cells showed minimal overlap and displayed distinct secretory profiles (Fig. EV2A–E). We also found that the majority of secretory markers were associated with p21+ cells and closely mirrored the patterns identified in the first dataset (Fig. EV2F). Consistent with our previous results, p16 expression significantly increased with age in the brain, whereas p21 upregulation was confined to specific cell clusters (Fig. EV2G,H). However, it is important to highlight that the first dataset was derived from isolated hippocampal tissue, whereas the second dataset included the entire brain. This distinction may account for some of the observed differences in cell distribution and secretory profiles between the two datasets.
Overall, these data emphasize the diversity as well as variability in p21+ and p16+ associated secretome profiles among cells with core features of senescence in the brain.
![Distinctandcell populations with differential secretory profiles in the murine hippocampus. p16+ p21+ () A t-SNE plot depicting the five main populations of young and old murine hippocampus (Ogrodnik et al,, GSE161340). () From the original population, CD45− cells are selected, followed by Ki67-negativity and cells not in the S phase. From these cells, just()+ cells and()+ cells are selected. From thecells, microglia and oligodendrocytes depict the main populations, while in thepopulation, microglia is predominant. () t-SNE visualization of + (red) and+ (blue) cells, along with a few double-positive cells (green), shown in the Cd45-Ki67-S- population. () The dPo (double positive) cells are high in bothand, whilecells just express, but noand vice versa. () Velocity depicts that there is no common ancestor forcells orcells, but that these are rather distinct entities. () The standard error for SASP factors is substantially higher in thecompared to thepopulation. () Utilizing the SenMayo gene set, SASP factors exclusively expressed bycells are fewer than those expressed incells, with some (,) being expressed by both. Very few secretory genes are expressed by-negative and-negative cells. The size of the dots represents the fold change compared to all other populations shown in (). A B C D E F G C [2021] p16 Cdkn2a p21 Cdkn1a p16+ p21+ p16 p21 Cdkn2a Cdkn1a p16+ Cdkn2a Cdkn1a p16+ p21+ p16 p21 p16+ p21+ Cxcl16 Plaur p16 p21](https://europepmc.org/articles/PMC12669595/bin/44318_2025_601_Fig1_HTML.jpg "Click to view full size")
Distinctandcell populations with differential secretory profiles in the murine hippocampus. p16+ p21+ () A t-SNE plot depicting the five main populations of young and old murine hippocampus (Ogrodnik et al,, GSE161340). () From the original population, CD45− cells are selected, followed by Ki67-negativity and cells not in the S phase. From these cells, just()+ cells and()+ cells are selected. From thecells, microglia and oligodendrocytes depict the main populations, while in thepopulation, microglia is predominant. () t-SNE visualization of + (red) and+ (blue) cells, along with a few double-positive cells (green), shown in the Cd45-Ki67-S- population. () The dPo (double positive) cells are high in bothand, whilecells just express, but noand vice versa. () Velocity depicts that there is no common ancestor forcells orcells, but that these are rather distinct entities. () The standard error for SASP factors is substantially higher in thecompared to thepopulation. () Utilizing the SenMayo gene set, SASP factors exclusively expressed bycells are fewer than those expressed incells, with some (,) being expressed by both. Very few secretory genes are expressed by-negative and-negative cells. The size of the dots represents the fold change compared to all other populations shown in (). A B C D E F G C [2021] p16 Cdkn2a p21 Cdkn1a p16+ p21+ p16 p21 Cdkn2a Cdkn1a p16+ Cdkn2a Cdkn1a p16+ p21+ p16 p21 p16+ p21+ Cxcl16 Plaur p16 p21
Comparing p16 and p21-associated secretome across murine tissues
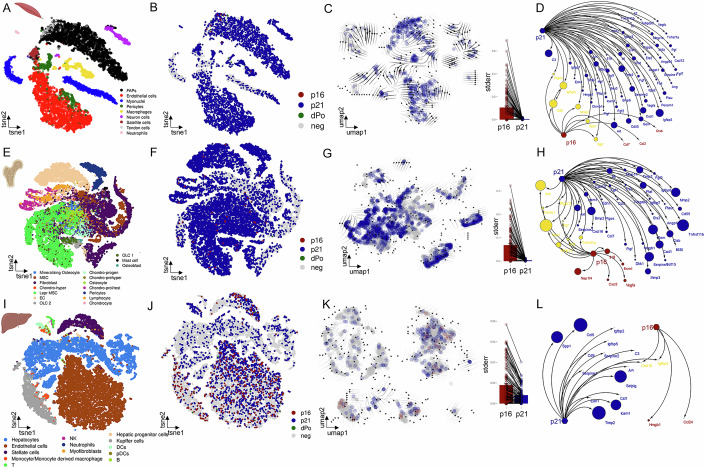
In our examination of all three tissues (Fig. 2), we observed a consistent pattern of distinct cell subpopulations that expressed either p21 or p16, with only a rare subset co-expressing both markers (Fig. 2B,F,J). Similar to our findings in the brain, RNA velocity and pseudotime analysis revealed that there was no evidence of a common ancestor between p21+ and p16+ cells, reflecting distinct developmental trajectories for each subpopulation. Furthermore, p16+ cells exhibited greater heterogeneity compared to p21+ cells (Fig. 2C,G,K).
In all three tissues, the p21+ cell population was considerably more abundant than the p16+ population. Using the SenMayo gene set, we found that the pattern observed in the brain was consistent across other tissues: while p16+ cells uniquely expressed a small subset of SenMayo factors, p21+ cells displayed a broader range of SenMayo genes (Fig. 2D,H,L). Although a small number of genes were co-expressed by cells positive for both p16 and p21, these were not consistently shared among the three tissues. Indeed, our investigations suggest that there is a distinctiveness in the composition of secretory profiles for each tissue, irrespective of the expression of p21 and p16. If we extend our analysis to a larger set of genes, including an extensive list from the Human Protein Atlas (Uhlén et al, 2015) plus SenMayo, we observe a consistent pattern across murine tissues: p21+ cells are associated with a larger secretome-associated transcriptional profile, with limited overlap in secreted gene expression between p21⁺ and p16⁺ cells (Fig. EV3A).
We confirmed the generality of our findings by performing the same analysis on separate independent scRNA-seq datasets from muscle (Fig. EV3B–J). Additionally, we assessed whether our analysis of the p16+ vs. p21+ secretome-associated transcriptional profile remained consistent when focusing on specific cell types. We found that a similar distribution of the p16+ vs. p21+ secretome was evident in fibro-adipogenic progenitors (FAPs) within skeletal muscle (Fig. EV3), in Lepr+ MSCs in bone (Fig. EV4A–J), and in endothelial cells in the liver (Fig. EV5A–J).
To determine if the two distinct cell populations are also present at the protein level in bone tissue, we analyzed data from mass cytometry by time-of-flight (CyTOF) on bones from young and aged mice (Doolittle et al, 2023). Similar to the scRNA-seq analysis, we excluded cells positive for Ki67 and CD45. Our analysis revealed distinct subsets of cells expressing either p21 or p16 exclusively, along with a rare subgroup co-expressing both markers at the protein level (Fig. EV6A–C). However, it is important to note that CyTOF relies on targeted panels of antibodies, which limited our analysis of secretory profile components. Most importantly, the lack of available SASP components makes it impossible to directly compare these proteomic data to our transcriptomic analyses. Nevertheless, we identified proteins such as Serpine1 exclusively expressed in p16+ cells and IL-6 exclusively expressed in p21+ cells, suggesting the existence of distinct secretory transcriptional profiles (Fig. EV6A–C). We further analyzed murine spleen (Fig. EV7A–E) and kidney (Fig. EV7F–J) using the Calico dataset (Kimmel et al, 2019). Consistent with our previous observations, p16+ and p21+ cells remained distinct populations in these tissues, each characterized by a unique secretome profile.
To determine whether the differences observed between p21+ and p16+ cell populations during aging are specific to age-related senescence or also occur in disease contexts, we compared our results with a mouse model of metabolic dysfunction-associated steatohepatitis (MASH) (Bendixen et al, 2024), a condition characterized by elevated senescence markers (Yashaswini et al, 2024) (Fig. EV8A–C). Similar to an aging liver, MASH showed minimal overlap between p21+ and p16+ cells (Fig. EV8B). However, the secretome transcriptional profiles associated with p21 and p16 in MASH were distinct from those observed in the aging liver (Fig. EV8D,E), suggesting that the composition of the secretory profile is influenced by the specific stimuli driving senescence in vivo.
Overall, our findings support the hypothesis that p21- and p16-expressing cells represent distinct senotypes with unique secretory profiles that vary depending on the tissue type and the senescence-inducing stimuli. This is in line with previous studies in which overexpression of p21 or p16 in mouse embryonic fibroblasts led to distinct secretome profiles (Sturmlechner et al, 2021), showing only partial overlap (Fig. EV9A,B).
![Comparative analysis ofandcells and their secretory phenotype in different murine tissues during aging. p16+ p21+ () In murine skeletal muscle (Zhang et al,, GSE172410), nine different cell types can be distinguished. ()cells constitute the majority, while double positive (dPo) cells are infrequent. () The developmental trajectory points to different points of origin for+- andcells. () The secretory phenotype is heterogeneous, withcells expressing a vast array of SASP factors, exhibiting minimal overlap with p16-associated secretory factors. () In murine bone (Baryawno et al,, GSE128423), 17 cell types can be distinguished. ()cells once again dominate the senescent cell population. () There is no common ancestor for+- andcells, and the () secretory profile in murine bone remains diverse, withcells expressing a larger number of secretory factors compared tocells. () In the murine liver (Su et al,, GSE166504), 13 different cell types are identified. () The liver has the lowest proportion ofcells from all tissues analyzed, although they still form the majority of senescent cells, with a few dPo cells. () There are different origins for+ and+ cells in the liver. () The secretory phenotype linked to p21 is more extensive than that associated with p16, with minimal overlap between the two. A B C D E F G H I J K L [2022] [2019] [2021] p21+ p16 p21+ p21+ p21+ p16 p21+ p21+ p16+ p21+ p16 p21](https://europepmc.org/articles/PMC12669595/bin/44318_2025_601_Fig2_HTML.jpg "Click to view full size")
Comparative analysis ofandcells and their secretory phenotype in different murine tissues during aging. p16+ p21+ () In murine skeletal muscle (Zhang et al,, GSE172410), nine different cell types can be distinguished. ()cells constitute the majority, while double positive (dPo) cells are infrequent. () The developmental trajectory points to different points of origin for+- andcells. () The secretory phenotype is heterogeneous, withcells expressing a vast array of SASP factors, exhibiting minimal overlap with p16-associated secretory factors. () In murine bone (Baryawno et al,, GSE128423), 17 cell types can be distinguished. ()cells once again dominate the senescent cell population. () There is no common ancestor for+- andcells, and the () secretory profile in murine bone remains diverse, withcells expressing a larger number of secretory factors compared tocells. () In the murine liver (Su et al,, GSE166504), 13 different cell types are identified. () The liver has the lowest proportion ofcells from all tissues analyzed, although they still form the majority of senescent cells, with a few dPo cells. () There are different origins for+ and+ cells in the liver. () The secretory phenotype linked to p21 is more extensive than that associated with p16, with minimal overlap between the two. A B C D E F G H I J K L [2022] [2019] [2021] p21+ p16 p21+ p21+ p21+ p16 p21+ p21+ p16+ p21+ p16 p21
Comparing the p16- and p21-associated secretome in human tissues during aging
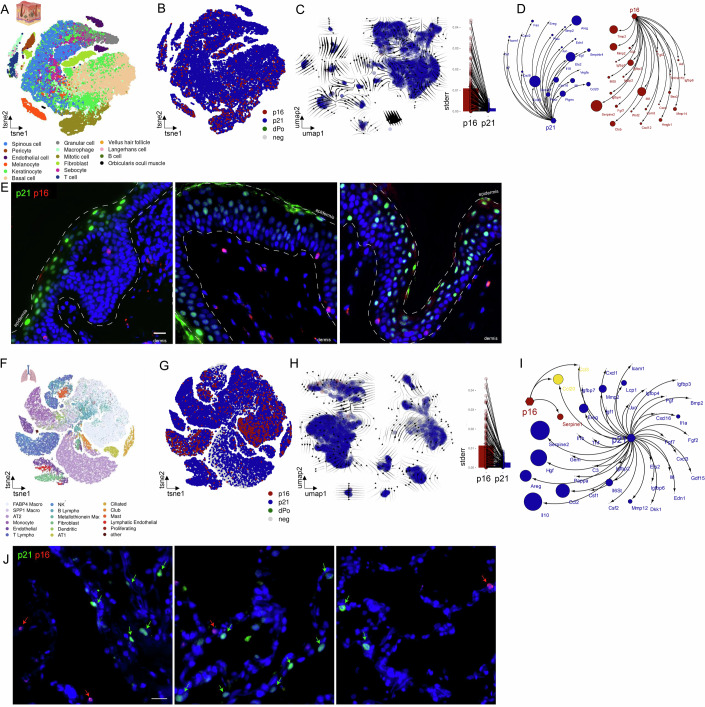
To further substantiate our mRNA-based findings, we performed immunofluorescence imaging of sun-protected aged human skin (Fig. 3E), which confirmed at the protein level, distinct populations of p16⁺ and p21⁺ cells (Fig. 3F).
We independently confirmed these findings using another human skin dataset (Solé-Boldo et al, 2020) (Fig. EV10E–J). Because all our previous observations were derived from scRNA-seq, we sought to validate these findings using an independent transcriptomic approach that also preserves spatial information. This was particularly important, as cell dissociation required for scRNA-seq may result in the loss of fragile senescent cells. Applying MERFISH to human skin confirmed that p16⁺ and p21⁺ cells represent distinct populations across different skin cell types, each with a divergent SASP profile and only minimal overlap (Fig. EV10K–M).
A similar pattern was observed in the human lung. Here we utilized a recently published scRNA-seq dataset from healthy human lungs ranging from 21 to 78 years of age (Jia et al, 2023). Within our analysis, we identified 18 distinct cell populations (Fig. 3F). After excluding Ki67+, CD45high and S-phase cells (Fig. EV11A–C), we observed that a significant majority of cells displayed p21 expression, while only a small number of cells exhibited p16 or the combination of p16 and p21 (Fig. 3G). There was no common ancestor, as demonstrated by RNA-velocity, and p16+ cells exhibited a heterogeneous secretome expression (Fig. 3H). Notably, cells that were p16+ demonstrated limited expression of SenMayo components, with Serpine1 being the exclusive gene expressed by this subgroup. In contrast, p21+ cells exhibited the expression of multiple SenMayo components (Fig. 3I). In addition, we analyzed alveolar type II (AT2) cells and again found distinct secretome transcriptional profiles associated with p21 and p16 (Fig. EV11D).
In an independent experiment, we analyzed human diseased lung tissue (COPD and pulmonary fibrosis/IPF) by immunofluorescence, which confirmed at the protein level the presence of distinct p16⁺ and p21⁺ cell populations (Fig. 3J).
We independently validated our findings in a murine lung dataset from the Calico dataset (Kimmel et al, 2019) (Fig. EV11E–J). When we broaden our examination to include a wider range of genes which involves a comprehensive list of secreted proteins (Uhlén et al, 2019) alongside SenMayo (Saul et al, 2022), we observed that there are relatively few secreted protein genes that are common between p21 and p16 expressing cells in both human and murine lung (Fig. EV11A,I,J). This further underscores the functional specificity inherent in these subpopulations.
![Comparative analysis ofandcells and their secretory phenotype in human skin and lung during aging. p16+ p21+ () In human skin samples (Zou et al,, HRA000395), 16 distinguishable cell populations are identified. () Among these populations,cells are notably abundant, while double-positive (dPo) cells are rare. () RNA-Velocity reveals a distinct pattern for+ and+ cells, and a higher heterogeneity regarding the secretory factor expression in+ cells. () The secretory profile expressed bycells is significantly larger compared to the secreted factors associated withcells. () Immunofluorescence analysis on aged human skin depicting+- (red) and+ (green) cells display distinct entities. Scale bar: 20 µm. () In the human lung (Jia et al,), GSE122960, GSE128033, GSE130148, and GSE212109), 18 discernible cell types are identified, and () within these cell types,cells constitute the majority of senescent cells. () RNA-Velocity reveals no common ancestor of+ andcells, while+ cells exhibit a more diverse secretory expression profile. () The secretory profile ofcells is extensive compared to that ofcells, with minimal overlap. () In human lung tissue (COPD and pulmonary fibrosis/IPF), similarly to aged skin tissue,+ (green) and+ (red) cells display distinct entities. Scale bar: 20 µm. . A B C D E F G H I J [2021] [2023] Source data are available online for this figure p21+ p16 p21 p16 p21+ p16+ p16 p21 p21+ p16 p21+ p16 p21+ p16+ p21 p16](https://europepmc.org/articles/PMC12669595/bin/44318_2025_601_Fig3_HTML.jpg "Click to view full size")
Comparative analysis ofandcells and their secretory phenotype in human skin and lung during aging. p16+ p21+ () In human skin samples (Zou et al,, HRA000395), 16 distinguishable cell populations are identified. () Among these populations,cells are notably abundant, while double-positive (dPo) cells are rare. () RNA-Velocity reveals a distinct pattern for+ and+ cells, and a higher heterogeneity regarding the secretory factor expression in+ cells. () The secretory profile expressed bycells is significantly larger compared to the secreted factors associated withcells. () Immunofluorescence analysis on aged human skin depicting+- (red) and+ (green) cells display distinct entities. Scale bar: 20 µm. () In the human lung (Jia et al,), GSE122960, GSE128033, GSE130148, and GSE212109), 18 discernible cell types are identified, and () within these cell types,cells constitute the majority of senescent cells. () RNA-Velocity reveals no common ancestor of+ andcells, while+ cells exhibit a more diverse secretory expression profile. () The secretory profile ofcells is extensive compared to that ofcells, with minimal overlap. () In human lung tissue (COPD and pulmonary fibrosis/IPF), similarly to aged skin tissue,+ (green) and+ (red) cells display distinct entities. Scale bar: 20 µm. . A B C D E F G H I J [2021] [2023] Source data are available online for this figure p21+ p16 p21 p16 p21+ p16+ p16 p21 p21+ p16 p21+ p16 p21+ p16+ p21 p16
Common p16 and p21 -associated secretomes across murine and human tissues
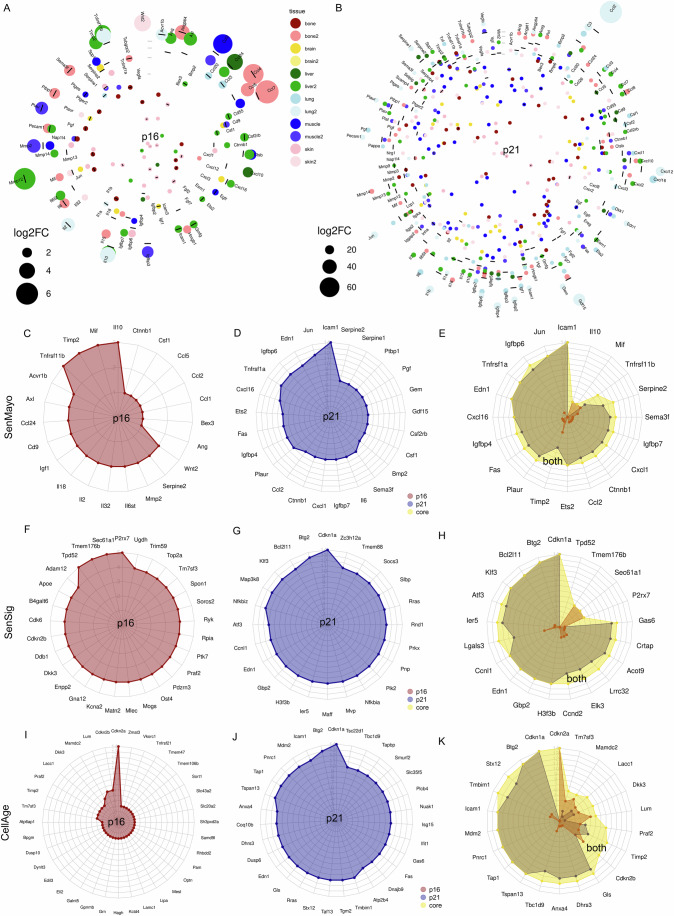
In the case of p21+ cells, we observed that Icam1 was consistently expressed across all six analyzed tissues, while several other factors, including Jun, Edn1, Igfbp6, Tnfrsf1a, Cxcl16, Ets2, Fas, Igfbp4, Plaur, and Ccl2 were expressed in eight or more of the 14 analyzed tissues (Fig. 4D). Combining p16 (red) and p21 (blue) markers that are expressed in more than one (p16) and five (p21) tissues, a "core" secretome profile comprised of Icam1, Jun, Igfbp6, Tnfrsf1a, Edn1, Cxcl16, Igfbp4, Fas, and Plaur is established. While Icam1 may exhibit a stronger association with p21, Igfbp4 and Igfbp6 are prominently expressed by both cell types, suggesting these as "common" p16/p21-associated secretory factors (Fig. 4E).
It should be noted that SenMayo mainly consists of secreted genes (c.a. 73%), while SenSig just has 265 secreted genes (c.a. 15%, based on the Human Protein Atlas), and CellAge has 78 secreted genes (c.a. 15%, based on the Human Protein Atlas). In our search for a common p21+ and p16+ secretome signature, we broadened our analysis to encompass a greater number of secreted factors by using SenSig (Cherry et al, 2023). This approach enabled us to identify 29 genes expressed in p16+ cells that were consistently present in (at least) four of the analyzed tissues (Fig. 4F). In p21+ cells, we identified 24 distinct genes expressed in a minimum of 11 tissues, and a single gene, Cdkn1a, was expressed in all analyzed tissues (Fig. 4G). Upon combining all factors to identify a "common" senescence-associated phenotype, we observed that Cdkn1a, Btg2, Bcl2l11, Klf3, Atf3, and Ier5 remain abundant primarily in p21+ cells. Additionally, Cdkn2b is expressed in four out of five tissues by p16+ cells (Fig. 4H). Using CellAge (Avelar et al, 2020) as reference gene set, the p16-associated genes were (next to Cdkn2a) Cdkn2b and Lum in 6 of the 14 datasets (Fig. 4I). The p21-associated genes were (next to Cdkn1a) Btg2, Icam1, Mdm2, Pnrc1, Tap1 and Tspan13, as expressed in 12 of the 14 datasets (Fig. 4J). The "core" secretory phenotype was (after Cdkn2a and Cdkn1a) mostly consisting of Btg2, Stx12 and Tmbim1 in 13 of the 14 datasets (Fig. 4K).
To further validate our findings, we leveraged the p21-Cre mouse model (Wang et al, 2024a) in which p21-positive cells were GFP-tagged in murine visceral fat tissue (Fig. EV12A,B). Using this model, we confirmed that GFP/p21-positive cells exhibited a significant enrichment of the previously identified p21-associated SenMayo, SenSig, and CellAge scores in GFP/p21-positive cells (Fig. EV12C–G).
![Common p16- and p21-associated secretory phenotype, SenSig, and CellAge across murine and human tissues. () The p16-associated secretory phenotype is characterized by the predominant presence of,, Ccl7, Mmp12, and, with some markers, such as, expressed in multiple tissues. () The p21-associated secretory phenotype displays greater diversity, with genes like,,, andcommonly expressed across tissues. () From the SenMayo panel, the p16-core-secreted factors includeand. () The p21-associated secreted factors are dominated byalong withthat are expressed consistently by+ cells in at least 11 of the 14 analyzed tissues. () A "core"-secreted phenotype for senescent cells comprises. (–) The significantly associated genes with p16 and p21, respectively, from SenSig (Cherry et al,) and (–) CellAge (Avelar et al,) gene sets. The depicted genes are those significantly overexpressed ( < 0.05, FC >0), with cell type colors corresponding to those in Figs. –. In (,), the dot size reflects the log2FC, the circular y-axis is in log- scale. For () only markers expressed in one or more tissues are shown; in () those expressed in eight or more tissues; in () those expressed in four tissues; and in (), those expressed in more than 11 tissues are displayed. A B C D E F H I K A B C D F G Ccl2 Ccl4 Ccl24 Tnfrsf11b Ccl2 Cxcl12 Cxcl16 Jun Il10, Mif, Timp2, Tnfrsf11b Icam1, Jun, and Edn1 Igfbp6 and Tnfrsf1a p21 Icam1, Jun, Igfbp6, Tnfrsf1a, and Edn1 p [2023] [2020] 1 3 10](https://europepmc.org/articles/PMC12669595/bin/44318_2025_601_Fig4_HTML.jpg "Click to view full size")
Common p16- and p21-associated secretory phenotype, SenSig, and CellAge across murine and human tissues. () The p16-associated secretory phenotype is characterized by the predominant presence of,, Ccl7, Mmp12, and, with some markers, such as, expressed in multiple tissues. () The p21-associated secretory phenotype displays greater diversity, with genes like,,, andcommonly expressed across tissues. () From the SenMayo panel, the p16-core-secreted factors includeand. () The p21-associated secreted factors are dominated byalong withthat are expressed consistently by+ cells in at least 11 of the 14 analyzed tissues. () A "core"-secreted phenotype for senescent cells comprises. (–) The significantly associated genes with p16 and p21, respectively, from SenSig (Cherry et al,) and (–) CellAge (Avelar et al,) gene sets. The depicted genes are those significantly overexpressed ( < 0.05, FC >0), with cell type colors corresponding to those in Figs. –. In (,), the dot size reflects the log2FC, the circular y-axis is in log- scale. For () only markers expressed in one or more tissues are shown; in () those expressed in eight or more tissues; in () those expressed in four tissues; and in (), those expressed in more than 11 tissues are displayed. A B C D E F H I K A B C D F G Ccl2 Ccl4 Ccl24 Tnfrsf11b Ccl2 Cxcl12 Cxcl16 Jun Il10, Mif, Timp2, Tnfrsf11b Icam1, Jun, and Edn1 Igfbp6 and Tnfrsf1a p21 Icam1, Jun, Igfbp6, Tnfrsf1a, and Edn1 p [2023] [2020] 1 3 10
Heterogeneous intercellular communication highlights the functional diversity ofandcells p21+ p16+
This heterogeneity is further reinforced when exploring the transcription factors that control gene expression in p16+ and p21+ cells. To achieve this, we employed SCENIC, a computational method that allows the prediction of interactions between transcription factors and target genes based on single-cell RNA-seq data (Aibar et al, 2017). SCENIC analyses reveal that transcription factors regulating gene expression in p16 (Fig. EV13A,B) and p21 (Fig. EV13C,D) positive cells were mostly tissue-specific, with minimal overlap between tissues. This implies that the secretory phenotype is not exclusively specific to p16+ or p21+ cells; rather, these cell subtypes are further transcriptionally regulated by factors specific to the tissue in which they are situated.
In summary, the diversity in cellular communication and transcriptional regulation between p16+ and p21+ cells within the unique environments of the six analyzed tissues underscores their heterogeneity and suggests potentially distinct functions.

Unequal communicational patterns betweenandcells across tissues. p21+ p16+ () The network centrality scores depict low (blue) and high (red) communication networks for seventeen significant interactions, withandcells shown pairwise in each tissue. () In the brain,cells exhibit higher interaction strength in CCL communication, primarily to microglia cells, whilecells demonstrate increased secretory activity via MAG to oligodendrocytes. () In bone,cells exclusively utilize the THBS and FN1 pathways to communicate with hypertrophic chondrocytes, osteoblasts, and lymphocytes. () In the skin,cells show higher interaction strength in the CD99-pathway to fibroblasts and melanocytes, whilecells predominantly signal through the DESMOSOME-pathway to granular and spinous cells, including sebocytes. () In muscle,cells mainly signal through the COLLAGEN and LAMININ pathways to fibro-adipogenic progenitors (FAPs) and tendon cells, as+ cells are too few for calculating communicational patterns. () In the liver, the JAM pathway is predominantly used bycells to communicate with myofibroblasts and hepatic progenitors, whereascells primarily employ the CDH5-pathway to interact with endothelial and Kupffer cells. () In the lung,cells exhibit the highest signaling strength in the CD45 pathway, mainly used to communicate with NK cells and T lymphocytes, whilecells primarily use the MIF pathway for contact with lymphatic endothelial and NK cells. Displayed are only significant interactions (adj < 0.05), with cell type colors corresponding to those in Figs. –. The color scale (blue-white-red) of the interactions in (–) corresponds to the centrality score in (). A B C D E F G B G A p21+ p16+ p21+ p16+ p21+ p16+ p21+ p21+ p16 p21+ p16+ p16+ p21+ p 1 3
Discussion
p21 and p16 are both associated with the induction of senescence, but they do not always occur together in senescence. Multiple in vitro studies have shown that their presence and expression can vary depending on the senescence-inducing stimuli, the cell type, and the specific context (Maciel-Barón et al, 2016).
p21 is a direct target of the tumor suppressor protein p53. When DNA damage or other stressors occur, p53 becomes activated and binds to the p21 promoter, leading to increased p21 expression. p21, in turn, inhibits the activity of cyclin-dependent kinases (CDKs), halting the cell cycle and promoting senescence. p16, on the other hand, acts through the Retinoblastoma (Rb) pathway (Serrano et al, 1993). p16 inhibits CDK4 and CDK6, which are responsible for phosphorylating Rb. When Rb is not phosphorylated, it remains active and prevents the cell from progressing through the cell cycle. Both pathways are intricate as they involve numerous upstream regulators and downstream effectors, as well as the presence of diverse side branches. Furthermore, these pathways exhibit substantial interconnections and crosstalk (Rayess et al, 2012).
p16 and p21 are the most commonly used markers for identifying senescent cells and have been highlighted as key indicators in recent consensus guidelines for detecting cellular senescence (Ogrodnik et al, 2024; Suryadevara et al, 2024). Their bulk expression has been extensively utilized to identify senescent cells in different tissues affected by aging or other pathological conditions (Gorgoulis et al, 2019). However, only recently, with the advancement of single-cell omics technologies, can we truly examine the full extent of their heterogeneity in vivo (Cohn et al, 2023).
Our study clearly demonstrates that, in various aging tissues, cells expressing p21 and p16 at both the transcript and protein levels predominantly constitute separate subpopulations characterized by mRNA expression of distinct secretomes. This suggests the activation of these two pathways may result in functionally diverse consequences and is reflected in the engagement of different intercellular communication pathways.
Some cells may be at different stages of senescence, with p21 being activated earlier in response to stress and p16 appearing at later stages, as observed in vitro (Stein et al, 1999). However, RNA velocity and pseudotime analyses across different tissues reveal that p21+ and p16+ cells follow independent trajectories without direct transitions between these states. Developing animal models that allow for the continuous tracking of p21 and p16 expression over time would provide crucial experimental validation for our findings regarding their distinct roles and origins.
Consistent with the functional diversity of these subpopulations, a recent study has demonstrated that p21 and p16 overexpression elicit distinct secretory phenotypes, with the p21-driven phenotype promoting immunosurveillance (Sturmlechner et al, 2021). p21 upregulation has also been suggested as a mechanism that enables senescent cells to resist apoptosis, thereby facilitating their retention in tissues (Yosef et al, 2017). Moreover, recently developed transgenic models where either p21+ or p16+ cells can be cleared have been shown to have different functional outcomes. For example, selective elimination of p21+ senescent cells, as opposed to pP16+ cells, effectively prevents radiation-induced bone loss (Chandra et al, 2022). Clearance of p16+ cells has been shown to extend median lifespan (Baker et al, 2016) while p21+ cell clearance has been recently shown to extend both median and maximum lifespan, further indicating distinct biological roles during aging (Wang et al, 2024a).
Interestingly, the composition of the secretome in cells expressing p21 and p16 exhibited significant variation across different tissues, with only a limited number of common factors. This observation holds significant conceptual implications. It indicates that the phenotypes resulting from the activation of senescence-associated pathways during aging are strongly influenced by the specific cell type involved. Moreover, it raises the intriguing possibility that distinct intrinsic mechanisms may contribute to senescence in various tissue types during aging. Finally, it suggests that analysis of SASP components in tissues should be comprehensive in nature and conducted at single-cell resolution. Considering the factors identified from the SenMayo dataset, which are most commonly associated with both p21 and p16-expressing cells, we found ample evidence in the literature supporting their increased expression or secretion by senescent cells and during aging. For instance, ICAM1 is upregulated in senescent cells (Gorgoulis et al, 2005). Similarly, IGFBP4 and IGFBP6 show increased levels in aging tissues and senescent cells (Coppé et al, 2008; Moiseeva et al, 2023), while EDN1 (Endothelin-1) expression increases in senescent vascular cells (Alcalde-Estévez et al, 2020). Additionally, CXCL16 is upregulated in aging and inflammatory conditions linked to senescence, and PLAUR (uPAR) is associated with extracellular remodeling and increased secretion by senescent cells (Amor et al, 2020).
Our findings on cell-cell communication patterns align with those reported by Lagger and colleagues, who combined the Tabula Muris Senis with the Calico murine aging cell atlas (Lagger et al, 2023). In our CellChat analyses, we observed a reduction in collagen signaling across four tissues, which was similarly identified in their study. Likewise, the consistent reduction of App in our analyses was highlighted in male tissues and connected to a range of tissue-specific diseases in their work.
Our SCENIC analyses identified several key regulators for p16- or p21-positive senescent cells. Notably, the regulation of p16-associated senescence by SOX5 aligns with findings from Tchougounova and colleagues, who demonstrated that SOX5 induces acute cellular senescence in the brain (Tchougounova et al, 2009). Similarly, we identified JunD and KLF4 as regulators of p21-associated cellular secretion, consistent with previous findings (Li et al, 2002; Chew et al, 2011).
While our study provides valuable insights into the distinct roles of p21 and p16 in different tissues, it is important to acknowledge the limitations of relying on scRNA-seq datasets. Single-cell RNA sequencing is powerful for capturing transcriptomic heterogeneity at a single-cell level, but it is constrained by technical biases such as drop-out effects and limited detection of low-abundance transcripts, which may overlook key components. These limitations suggest that integrating additional modalities, such as single-cell proteomics or spatial transcriptomics, could provide a more complete picture of the functional specialization of senescent cells. Taking this into consideration, we confirmed the lack of co-localization between p16 and p21 at the protein level using immunofluorescence and validated these findings with MERFISH, a spatial transcriptomics technique that preserves tissue architecture and avoids artifacts from cell dissociation. These complementary approaches support the conclusion that p16+ and p21+ cells represent distinct populations. Nevertheless, our study has not yet addressed SASP heterogeneity using spatial proteomics, emphasizing the need for broader analyses in future work.
These limitations notwithstanding, our findings do hold significant implications for the implementation of senolytic therapies in clinical contexts. They underscore the importance of adopting a context-specific approach, not just taking into consideration the subtype of senescent cells, but also the tissue which is being targeted.
Methods
Additional details of reagents and software used are provided in the Reagents and tools table.
| Reagent/resource | Reference or source | Identifier or catalog number |
|---|---|---|
| Experimental models | ||
| Recombinant DNA | ||
| Antibodies | ||
| P16 | Ventana | 725-4793 |
| P21 | Cell Signaling | 2947S |
| Oligonucleotides and other sequence-based reagents | ||
| CDKN2A probe | Vizgen | ENST00000579755 |
| Chemicals, enzymes and other reagents | ||
| NGS | Agilent-Dako | X090710-8 |
| Citrate buffer | Agilent-Dako | S236984 |
| ProLong Gold Antifade Mountant | Invitrogen | P10144 |
| Software | ||
| RStudio | Posit PBC | |
| Cytoscape v3.1.0 | http://www.cytoscape.org | |
| MERSCOPE visualizer (2.3) | Vizgen, Inc. | |
| Other | ||
Single-cell analysis
The scRNA-seq data were aligned and quantified using the 10X Genomics Cell Ranger Software Suite (v6.1.1) against the murine reference genome (mm10) and human reference genome (hg19). The Seurat package (v4.3.0.1 and 5.0.0) (Butler et al, 2018; Stuart et al, 2019) was used to perform integrated analyses of single cells. Genes expressed in <3 cells and cells that expressed <200 genes and >20% mitochondria genes were excluded from downstream analysis in each sample. The datasets were SCTransform-normalized, and the top 3000 highly variable genes across cells were selected. The datasets were integrated based on anchors identified between datasets before principal component analysis (PCA) was performed for linear dimensional reduction. After normalization and scaling, a shared nearest neighbor (SNN) graph was constructed to identify clusters in the low-dimensional space (top 30 statistically significant principal components, PCs). An unbiased clustering according to the recommendations of the Seurat package was used, if not provided by the authors. The cell types were assigned according to the authors' recommendations or provided metadata. The alluvial plots were designed with the ggalluvial package (v0.12.5). For the DimPlots, the RNA slot was used, and every value above 0 was counted as "positive". After normalization and scaling, we proceeded with the differentially expressed genes analyses.
The differentially expressed markers were identified by the FindMarkers function (ident.1 was specified, and differences calculated to all other clusters) and the Wilcoxon signed-rank test. We used the SenMayo gene set (n = 125) or secreted proteins, obtained by the human protein atlas, augmented by the SenMayo secreted SASP factors (n = 1989 (Uhlén et al, 2019)) to select the SASP factors or secreted proteins. The cytoscape bubble plots were designed with cytoscape (v3.1.0), and the size of each bubble is proportional to the avg_log2FC. The circular plots were designed with ggplot2 (v3.4.4). The spider plots were designed with the package fmsb (v0.7.5). The circle size is proportional to the log2FC compared to all other clusters, while the color codes the respective tissue. The bars show the median of all tissues in which the respective gene is upregulated.
RNA Velocity analyses were performed using scVelo as an unbiased measurement of velocity. Here, unsliced and spliced mRNAs are used to predict cellular states, given that the unspliced counts precede the spliced counts (La Manno et al, 2018). After the direction of the velocity had been obtained, a depiction of the trajectory has been done via PhyloVelo, more closely translating the transcriptional dynamics of splicing kinetics with a likelihood-based, more dynamical model (Wang et al, 2024b). In some tissues, these analyses are further amended by a graphical representation with monocle3 (Cao et al, 2019).
Regarding the heterogeneity analyses, the standard error was calculated as standard deviation, divided by the square root of the sample size for each of the SenMayo SASP factors, separated by p16- or p21-positivity.
For the intercellular communication heatmap, we first calculated the respective intercellular communication via CellChat (v1.6.1). The centrality values were extracted and used for the central heatmap, for which we used GraphPad Prism (Version 9.0). The probability of the inferred communication was used for the sankey-network. The depiction of the sankey-network was done via the networkD3 package (v0.4) and exported via jsonlite (v1.8.7). Since muscle had too little p16+ cells for the CellChat analyses, these were excluded.
For the SCENIC analyses, we used the standard settings (v.1.3.1). For plotting the most important factors, the relative activity for each transcription factor above 1 was chosen for p21+ and P16+ cells, respectively, per tissue. Since the liver has very few p16+ cells for proper calculation with SCENIC, these were excluded. For the pie charts, the sum of transcription factors sharing a tissue was calculated, and the respective percentage is demonstrated within the plot.
| Figure | Organ | Species | GSE | PMID | Methodology |
|---|---|---|---|---|---|
| Fig. 1 | Hippocampus | Mus musculus | GSE161340 | 33470505 | scRNA-Seq |
| Fig. 2a-d | Skeletal muscle | Mus musculus | GSE172410 | 36147777 | scRNA-Seq |
| Fig. 2e-h | Bone | Mus musculus | GSE128423 | 32103177 | scRNA-Seq |
| Fig. 2i-l | Liver | Mus musculus | GSE166504 | 34755088 | scRNA-Seq |
| Fig. 3a-d | Skin | Homo sapiens | HRA000395 | 36049540 | scRNA-Seq |
| Fig. 3f-i | Lung | Homo sapiens | GSE122960 | 30554520 | scRNA-Seq |
| Lung | Homo sapiens | GSE128033 | 31221805 | scRNA-Seq | |
| Lung | Homo sapiens | GSE130148 | 31209336 | scRNA-Seq | |
| Lung | Homo sapiens | GSE212109 | 37706427 | scRNA-Seq | |
| Ext. Fig. 2 | Brain | Mus musculus | GSE129788 | 31551601 | scRNA-Seq |
| Ext. Fig. 3e–i | Skeletal muscle | Mus musculus | GSE132042 | 32669714 | scRNA-Seq |
| Ext. Fig. e–i | Bone | Mus musculus | GSE132042 | 32669714 | scRNA-Seq |
| Ext. Fig. e–i | Liver | Mus musculus | GSE132042 | 32669714 | scRNA-Seq |
| Ext. Fig. 6q | Bone | Mus musculus | GSE237301 | 37524694 | CyTOF |
| Ext. Fig. 7a–e | Spleen | Mus musculus | GSE132901 | 37972658 | scRNA-Seq |
| Ext. Fig. 7f–j | Kidney | Mus musculus | GSE132901 | 37972658 | scRNA-Seq |
| Ext. Fig. 8 | Liver | Mus musculus | GSE218300 | 37972658 | scRNA-Seq |
| Ext. Fig. 9 | MEF | Mus musculus | GSE117278 | 35764649 | bulk RNA-Seq |
| Ext. Fig. 10e–i | Skin | Homo sapiens | GSE130973 | 32327715 | scRNA-Seq |
| Ext. Fig. 11 | Lung | Mus musculus | GSE132901 | 37972658 | scRNA-Seq |
| Ext. Fig. 12 | Adipose tissue | Mus musculus | GSE269660 | 39111286 | scRNA-Seq |
Cytometry by time-of-flight (CyTOF) analysis
The provided fcs-files were read into R by the flowCore package (v2.8.0) and transformed into a Seurat object. All subsequent analyses followed the standard Seurat procedure as described above.
RNA-sequencing analysis
The fastq files were mapped to the murine genome (mm10), and analysis was performed using the DESeq2 package (v1.38.3) as previously described (Saul et al, 2022). Significantly differentially regulated genes were selected by a Benjamini–Hochberg adjusted p value <0.05 and log2-fold changes above 0.5 or below −0.5.
Immunofluorescence staining of FFPE tissue sections
Formalin-fixed, paraffin-embedded (FFPE) tissue sections (5 µm) were prepared from three sun-protected aged skin biopsies from individuals aged 73, 79, and 83 years, and two lung tissue sections from 75-year-old individuals diagnosed with IPF and with COPD, respectively.
Sections were deparaffinized in Histoclear (twice, 5 min each) and rehydrated through a graded ethanol series: 100% ethanol (twice, 5 min each), 90% ethanol (twice, 5 min each), 70% ethanol (1 × 5 min), followed by two washes in distilled water (5 min each). Antigen retrieval was performed by heating the slides to boiling in citrate buffer (pH 6.0; Agilent-Dako, S236984) for 10 min. Slides were allowed to cool at room temperature for 30 min and then rinsed twice in PBS (5 min each).
Tissue sections were blocked with 1% BSA and 1:60 normal goat serum (NGS; Agilent-Dako, X090710-8) for 30 min at room temperature, followed by overnight incubation with primary antibodies at 4 °C. The next day, sections were washed in PBS and incubated with appropriate secondary antibodies for 1 h at room temperature. After three additional PBS washes, slides were mounted using ProLong™ Gold Antifade Mountant with DAPI (Invitrogen).
The primary antibodies used were anti-p16 (725-4793) mouse monoclonal (dilution as provided by kit, VENTANA) and anti-p21 (2947S) (1:200, Cell Signalling).
MERFISH analysis
A punch biopsy was collected from the upper thigh of a 66-year-old individual. Following collection, the sample was cleaned and the surrounding adipose tissue was carefully removed. The tissue was then centered in a plastic embedding mold, embedded in OCT compound, and rapidly frozen by immersion into super-cooled isopentane, which had been pre-chilled in a metal container placed within a liquid nitrogen bath. Using forceps, the mold was carefully lowered into the isopentane–liquid nitrogen bath without full submersion. Once the OCT was fully solidified, the tissue blocks were stored at –80 °C until shipment to the manufacturer.
MERFISH was performed by the manufacturer (Vizgen) using the pre-designed ImmunOncology gene panel in combination with a custom-designed probe targeting CDKN2A (ENST00000579755). The ImmunOncology panel included 550 genes encompassing markers of cellular senescence, cell-cycle regulation, inflammation, immune cell types and others. All steps of the MERFISH workflow, including tissue preparation, hybridization, imaging, and data acquisition, were conducted by Vizgen according to their standardized protocols. The resulting data were exported using the MERSCOPE Visualizer software, version 2.3 (Vizgen, Inc.).
The spatial coordinates were extracted and transferred into a UMAP using the Seurat package (v 5.0.0).
Statistics
Statistical analyses were performed using either GraphPad Prism (Version 9.0) or R version 4.2.0. A p value <0.05 (two-tailed) was considered statistically significant.
Ethics statement
Human sun-protected skin tissue samples were obtained from participants at Mayo Clinic and from the Baltimore Longitudinal Study on Aging (BLSA). At Mayo Clinic, skin biopsies were collected from consented participants under IRB protocol 21-008529, in accordance with the International Conference on Harmonization, Good Clinical Practice guidelines, and the Declaration of Helsinki. Samples from BLSA participants were collected under a protocol approved by the Institutional Review Board of the Intramural Research Program of the National Institutes of Health (protocol #03AG0325). Human lung tissues were obtained incidentally during clinically indicated thoracic surgeries under IRB-approved protocols (Mayo IRB 08-002518), with informed consent obtained prior to collection. All samples were de-identified before analysis.
Supplementary information
Peer Review File Source data Fig. 3 Expanded View Figures