
What this is
- () is a newly identified process for degrading cytosolic proteins in late endosomes.
- This research investigates in rainbow trout hepatocytes, revealing its activation by various cellular stresses.
- Findings indicate that may compensate for impaired () under specific stress conditions.
Essence
- is activated in rainbow trout hepatocytes by oxidative stress, high glucose, DNA damage, and nutrient deprivation. This process may serve as a compensatory mechanism when is impaired.
Key takeaways
- is triggered by oxidative stress, high glucose, DNA damage, and nutrient deprivation in trout hepatocytes. This suggests a specific response to cellular stressors.
- The study demonstrates that -like puncta formation relies on KFERQ-like motifs and ESCRT machinery, independent of and macroautophagy. This independence highlights the distinct regulatory mechanisms of .
- The findings propose that may play a compensatory role when is dysfunctional, indicating a potential interplay between these autophagic pathways during cellular stress.
Caveats
- The study primarily focuses on in vitro models, which may not fully replicate in vivo conditions. Further research is needed to confirm these findings in live organisms.
- While the research identifies stressors activating , the long-term implications of this process on cellular health and metabolism require further investigation.
Definitions
- endosomal microautophagy (eMI): A selective autophagic process where cytosolic proteins are captured in late endosomes for degradation.
- chaperone-mediated autophagy (CMA): A pathway that transports specific proteins to lysosomes for degradation, involving recognition by the LAMP2A receptor.
Simplified
Introduction
Endosomal microautophagy (eMI) is a recently discovered autophagy process in which cytosolic proteins are selectively trapped in vesicles formed at the membrane level of late endosomes (LE)1. eMi can be considered as the "sister" pathway of the more studied chaperone-mediated autophagy (CMA)2, as both are characterized by the selective targeting of cytosolic proteins containing a pentapeptide sequence biochemically similar to KFERQ (lysine-phenylalanine-glutamate-arginine-glutamine)3. Both processes initiate with the recognition of a KFERQ-like motif by HSC70 (heat shock protein family A (Hsp70) member 8, also known as HSPA8) and co-chaperones4–6. For CMA, after binding to the limiting CMA receptor LAMP2A (lysosomal associated membrane protein 2A)7,8, the substrates are targeted and translocated into lysosomes for degradation. In contrast, during eMI, the substrate is targeted to the LE membrane via the binding to negatively charged phosphatidylserine residues2. The cargo is then internalized thanks to the mediation of some members of the ESCRT machinery (Tsg101 and Alix) and the ATPase Vps4, forming multivesicular bodies (MVB)1,9,10. Afterwards, the KFERQ-containing protein can be degraded directly within LE/MVB, or after the fusion of these with lysosomes. Otherwise, the substrate can also be secreted after the fusion of LE/MVB with the plasma membrane11–13.
Although the characteristic KFERQ-like motif, required for eMI and CMA targeting, is present in up to 75–80% of the total proteome from yeast to mammals14, it is particularly noteworthy that this motif is present in key proteins involved in the control of transcription, cell cycle and cellular energetics, among others key cellular processes6,14. Thus, through the selective degradation of those motif-bearing proteins, eMI could play a critical role in maintaining cellular homeostasis and metabolism, as demonstrated for CMA15–22. In this regard, CMA malfunction has been associated with diverse pathological situations23–27, and similarly, the reduction of eMI during aging has been associated with the progression of some proteinopathies12,28,29. Consequently, the interaction between both pathways in targeting KFERQ proteins could be a key step in the adequate remodeling of the cellular proteome during health and disease. For example, the KFERQ-containing protein TAU, linked to cellular senescence and brain disorders (tautopathies)30, can be degraded through both CMA and eMI29, and during CMA impairment, acetylated TAU is rerouted to eMI12. Therefore, exploring the specificities of the regulation of both pathways could reveal novel aspects about the control of metabolism and cellular homeostasis. For instance, eMI and CMA are reciprocally regulated during sustained starvation9,31, pointing to a specialization of functions, action scenarios or preferred targets between these two autophagic pathways that deserve further research.
Recently, we provided functional evidence for the existence of a CMA pathway in fish, opening new perspectives for approaching this function from both novel and evolutionary perspectives27. This discovery highlighted the compelling need of using new models organisms, such as zebrafish (Danio rerio)—a powerful model for functional studies—and rainbow trout (RT, Oncorhynchus mykiss)—a model species with impaired glucose tolerance – to better decipher the fundamental processes engaged in this function20–22. In contrast, the ability of fish to perform eMI has so far not been reported nor explored32. However, our latest research in RT revealed that in vitro silencing of the CMA-limiting factor lamp2a led to significantly increased levels of the endosomal sorting complexes required for transport-I (ESCRT-I) protein tumor susceptibility 101 (Tsg101)20, critical for eMI in mammals1. This suggested that an eMI-like process may compensate for impaired CMA activity, as seen in mammals9,12. Here, using a fluorescent eMI reporter originally developed for fruit flies33, we identified and characterized an eMI-like pathway in a RT hepatocyte cell line. Under mild-oxidative stress, the fluorescent biosensor accumulated in puncta that co-localized with LE. Interestingly, while the formation of these KFERQ-like motif-dependent puncta is directly related to the ESCRT machinery, it has noteworthy been shown to be totally independent of CMA and macroautophagy (MA). We also found the RT eMI-like process was triggered by hyperglycemic stress, DNA damage and nutrient deprivation, but not by foetal bovine serum (FBS) removal, showing selective induction. In summary, these results demonstrate for the first time the presence of an eMI-like process in fish, offering new opportunities and models to study this autophagic pathway and its interactions with CMA.
Results and discussion
The core eMI machinery is expressed in fish tissues and RTH-149 cells

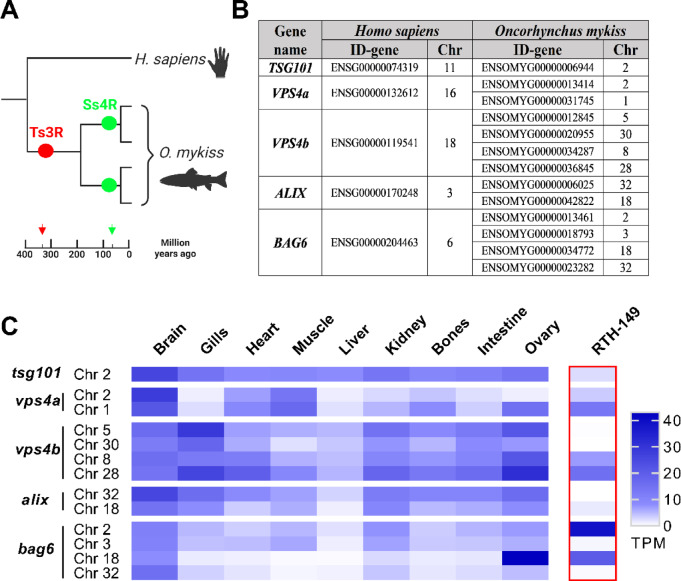
The core eMI machinery is present and expressed in(RT, rainbow trout) tissues and the RT-derived RTH-149 cells. () Schematic representation of the evolutionary history of RT genes showing the third round of genome duplication (Ts3R) experienced by teleost fish, and the additional round of whole-genome duplication (Ss4R) of salmonids. () Identification (Ensembl ID) and chromosome location (Chr) of the main eMI-genes (,,,and) in the human genome, and their corresponding RT orthologs. () Heat map showing mRNA expression levels (TPM, transcripts per million) of the different identified genes in different tissues of RT (brain, gills, heart, muscle, liver, kidney, bones, intestine and ovary) extracted from the RNA-Seq database PhyloFish, as well as in RTH-149 cells (framed with red line) analyzed by BRB-Seq in the current work. Oncorhynchus mykiss TSG101 VPS4A VPS4B ALIX BAG6 A B C
Mild-oxidative stress induces eMI-like puncta that co-localize with LE in RTH-149 cells
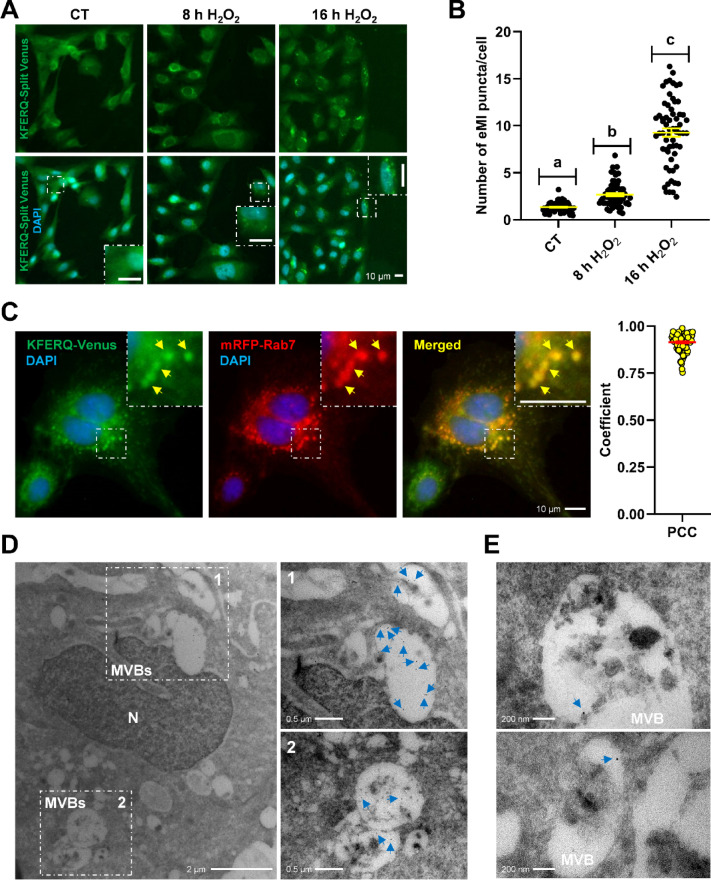
These results suggest that mild-oxidative stress in RT cells induces the targeting of KFERQ-containing proteins to LE in a process similar to eMI in flies and mammals6.

Mild-oxidative stress (HO25 µM) induced the targeting of the eMI-reporter Venus to late endosomes through an eMI-like process in RT cells. () Representative images of RTH-149 cells stably expressing an eMI-reporter consisting in a KFERQ recognition motif fused to either the N-terminal or C-terminal of split Venus and visualized by fluorescence microscopy. The exposure to HO25 µM, for either 8 h or 16 h, induced the reconstitution of the Venus fluorescent protein (green) and the formation of Venus-puncta, in comparison with the CT, where the reporter showed a diffuse distribution with only discrete and scattered puncta standing out from the background noise. Nuclei were stained with DAPI (blue) and the inset show an amplified region of each image. () Quantification of KFERQ-Venus number of puncta per cell. All values correspond to individual images (CT 63; 8 h HO63; 16 h HO63), with > 18 images/experiment in a total of 3 independent experiments (> 600 cells per condition). Different letters denote significant differences between groups compared by the non-parametric Kruskal–Wallis test (p < 0.0001) followed by Dunn's multiple comparisons tests. All data are presented as Mean ± SEM; scale bars: 10 µm. () Representative images of HO-induced KFERQ-Venus puncta (green) in cells transiently transfected with RAB7-RFP (red) visualized by fluorescence microscopy. Most of the KFERQ-Venus puncta co-localized with the red late endosome marker RAB7-RFP, as indicated by the yellow arrowheads and amplified in the insets, and as supported by the positive Pearson's correlation coefficient (PCC) results of the global analysis of 85 single cells using the BIOP version of JACoP plugin for Fiji. Scale bars: 10 µm. () Representative immunoelectron microscopy images of HO-incubated RTH-149 cells expressing the eMI sensor (Venus) using anti-Venus antibody, showing Venus immunoreactivity (arrowheads in the amplified insets) within MVBs. Scale bars: 2 µm or 0.5 µm (insets). () Other two representative IEM images at a higher magnification showing Venus immunoreactivity (arrowheads) within MVBs. Scale bar: 200 nm. 2 2 2 2 2 2 2 2 2 2 2 2 A B C D E
The occurrence of eMI-like puncta under mild-oxidative stress depends on KFERQ-like motif and relies on ESCRT machinery but not on CMA nor on MA
To next evaluate whether the KFERQ- and ESCRT-I-dependent but CMA-independent eMI-like puncta might also rely on MA, we designed a Mo to inhibit the translation of mRNAs encoding the E1-like enzyme Atg7 in the RT. This approach aims to impair MA initiation40. First, we found that the reduction of Atg7 by Moatg7 led to a significant reduction in the conjugation of Atg5 to Atg12 (Supplementary Fig. 2G and H), a key process in MA initiation recognized to be dependent on the activity of Atg741. Besides, we assessed LC3 lipidation as a readout of the MA flux after exposing cells to H2O2, with or without the autophagosome-lysosome fusion inhibitor chloroquine (CQ, at 10 µM)42. Moatg7 markedly reduced LC3-II levels compared to cells transfected with the negative control oligo (MoSTD–) (Fig. 3G; quantification in Fig. 3H). Together with the loss of Atg12–Atg5 complex formation, this confirmed effective MA inhibition. We then examined Venus-puncta formation under mild-oxidative stress and observed that MA inhibition did not decrease the number of eMI-sensor puncta (Fig. 3I, quantification in Fig. 3J). Instead, it increased the puncta count compared to MoSTD-, similar to findings in Drosophila fat body36. This suggests that increased cellular stress might enhance eMI-like process in RT as well.
Together, our results demonstrate that the formation of the KFERQ-Venus puncta upon H2O2 incubation specifically relies on ESCRT-I machinery but is indeed independent of both CMA and MA activities, supporting -for the first time- the existence of an eMI-like process in fish. Interestingly, we have observed that the activity of such process in RT increases when either CMA or MA are impaired, which points to an established and probably finely tuned crosstalk between these autophagy pathways to maintain cellular proteome homeostasis. This interaction certainly warrants further research.

The occurrence of eMI-like puncta under mild-oxidative stress depends on the KFERQ motif and the ESCRT machinery, but not on CMA nor on MA. () Representative images of RTH-149 cells expressing either the KFERQ-Venus proteins or their mutated versions (i.e., KFEAA-Venus) and exposed to HO25 µM for 16 h, and () quantification of the corresponding number of Venus puncta per cell. All values correspond to individual images (KFERQ 94; KFEAA 96), with > 30 images/experiment in a total of 3 independent experiments (> 2000 cells per condition). Differences between the two groups were assessed using Mann Whitney test ( < 0.0001). Transfection of RTH-149 cells with sireduced significantly the proteins levels of Tsg101, as it can be observed in () the representative western blot image of Tsg101 and the total protein stain (No-Stain), and () the densitometry quantification of Tsg101 normalized with No-Stain. Differences with respect to the siwere assessed using Unpaired Student's T-test ( < 0.002) in four independent experiments with duplicates. () Representative images of RTH-149 cells expressing the eMI-reporter transfected with either negative control siRNA (si), si, or a combination of two siRNAs targeting the twoparalogs (si) of RT, and incubated with CT medium or exposed to mild-oxidative stress (HO25 µM) for 16 h, and the () quantification of KFERQ-Venus number of puncta per cell. All values correspond to individual images (siCT 96; siHO101; siCT 96; siHO96; siCT 96; siHO95), with > 31 images/experiment in a total of 3 independent experiments (> 600 cells per condition). Differences between two groups were assessed using parametric Unpaired Student's T-test or the non-parametric Mann Whitney test, and thevalues are indicated in the figure. () Representative image of western blot against LC3B in RTH-149 cells transfected with a morpholino oligonucleotide (Mo) targeting RT Atg7 (Mo) or a negative control (Mo), exposed during 16 h to HO25 µM and additionally incubated with or without 10 µM chloroquine (CQ), and () quantification of LC3-II protein levels normalized to No-Stain. Differences between groups were assessed using parametric Unpaired Student's T-test (Mogroup) or non-parametric Mann Whitney test (Mo) in three independent experiments with duplicates. () Representative images of RTH-149 cells expressing the eMI-reporter transfected with either Moor Moand exposed to HO25 µM for 16 h, and () quantification of KFERQ-Venus number of puncta per cell. All values correspond to individual images (Mo88; Mo90), with > 21 images/experiment in a total of 3 independent experiments (> 600 cells per condition). Differences between the two groups were assessed using Mann Whitney test ( < 0.0001). All data are presented as Mean ± SEM; scale bars: 10 µm. A B C D E F G H I J 2 2 2 2 2 2 2 2 2 2 2 2 2 2 p tsg101 LUC p LUC tsg101 lamp2a lamp2a LUC LUC tsg101 tsg101 lamp2a lamp2a p atg7 STD- atg7 STD- STD- atg7 STD- atg7 p
eMI induction in RT is stimulus-specific
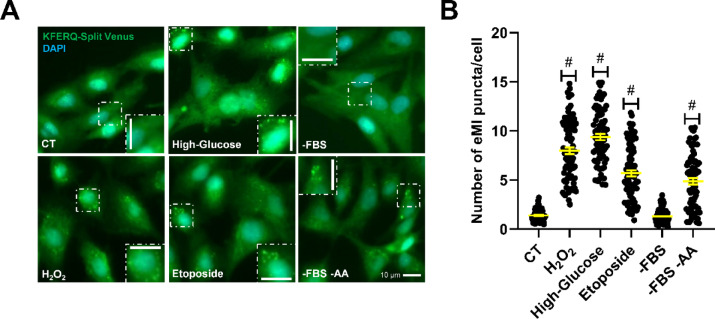
We then examined the effect of genotoxic insults by inducing DNA double-strand breaks with etoposide (50 µM)45. Our results showed that etoposide clearly increased Venus puncta compared to CT (Fig. 4A, quantification in Fig. 4B), similarly to findings in Drosophila36 and mammals37. In mammals, CMA participates in the selective degradation of the checkpoint kinase 1 (Chk1), a KFERQ-motif containing protein, to ensure cell cycle progression after DNA repair46. Conversely, CMA impairment was associated with defects in nuclear proteostasis, genomic instability and reduced cell survival46. Although it remains to be determined whether Chk11 can also be targeted by eMI, these findings suggest a conserved protective mechanism that maintains genome integrity through the degradation of KFERQ-substrates after DNA damage, which could be, at least partly, fulfilled by eMI in RT.
Finally, we observed that serum starvation (-FBS), known to induce both CMA3,39,47 and MA in various species, including RT48–50, did not alter Venus-puncta formation. In contrast, combined serum and amino acids deprivation (-FBS -AA) with HBSS medium for 16 h substantially increased eMI-like puncta compared to CT (Fig. 4A, quantification in Fig. 4B). This aligns with increased eMI during prolonged nutrient deprivation in the CMA-deficient species Drosophila43. In mammals, where both CMA and eMI pathways are present, the regulation of eMI during nutrient deprivation is more complex28. Short-time (1 h) HBSS exposure triggers an ESCRT-III-dependent, but ESCRT-I and Hsc70-independent, eMI variant in human cell lines. This variant likely degrades selective autophagy receptors (e.g., LC3B and GABARAPL2), preventing unwarranted selective MA in the short-term, while enhancing bulk MA during prolonged starvation51. Conversely, long-term nutrient starvation, a well-known CMA activator31, inhibits eMI in rodents, likely due to the CMA-mediated degradation of the eMI component BAG69. This research highlights the possible role of BAG6 as a switcher, directing KFERQ-containing proteins to either eMI or CMA and enabling these pathways to compensate for each other's deficiencies. In RT, although the silencing of bag6 appears to inhibit the eMI process similar to what was observed in mice9, both autophagic pathways function simultaneously during stress, such as mild-oxidative stress and nutrient deprivation (16 h), targeting KFERQ-containing proteins to lysosomes and LE/MVB. This raises the question of whether a Bag6-dependent mechanism coordinates both eMI and CMA pathways in RT as observed in mammals. However, the differences between our results and those in mammals may stem from the experimental models used. In our in vitro model, -FBS -AA represents an acute condition with negligible extracellular levels of these compounds, while mammalian studies involved in vivo nutrient starvation experiments9, where circulating nutrient and growth factor levels likely remain physiological. To the best of our knowledge, no data exists on the in vitro activity of eMI in mammals during both long-term and acute nutrient deprivation. Therefore, we cannot ruled out that the simultaneous activation of CMA and eMI observed in the present study may be a conserved physiological response regarding extreme cellular stress across vertebrates.
In summary, we identified and characterized an eMI-like pathway in a RT hepatocyte cell line. This process is induced by oxidative stress, DNA damage, or nutrient deprivation, mirroring findings in Drosophila36,43, but not in response to FBS removal, supporting that eMI induction in RT is stimulus-specific. These findings suggest a significant role for this eMI-like process in fine-tuning the cellular proteome during stress in RT. Moreover, they open new avenues for exploring this function using complementary model organisms, such as zebrafish and RT.

Different cellular stressors, although not serum starvation, activated eMI-sensor puncta formation in RTH-149 cells. () Representative images of RTH-149 cells expressing the eMI-reporter and incubated for 16 h with either CT medium, HO(25 µM), glucose (25 mM, High-Glucose), etoposide (50 µM), a medium lacking serum (-FBS) alone, or a medium lacking both serum and amino acids (-FBS –AA). () Quantification of KFERQ-Venus number of puncta per cell. All values correspond to individual images (CT 80; HO86; High-Glucose 76; Etoposide 86; –FBS 87; –FBS –AA 76), with > 15 images/experiment in a total of 3 independent experiments (> 600 cells per condition). Differences between two groups were assessed using the non-parametric Mann Whitney test, and thevalues are indicated in the figure. All data are presented as Mean ± SEM; scale bars: 10 µm. A B 2 2 2 2 p
Materials and methods
Laboratory ware and reagents
Minimum Essential Medium (61,100-053), essential (11,130-036) and non-essential amino acids (11,140–050), L-glutamine (25,030-024), sodium pyruvate (11,360-070), penicillin–streptomycin (15,140-122), geneticin (11,811,031), neomycin (11,598,906), puromycin (10,296,974), fetal bovine serum (10,270-106), and Hank's Balanced Salt Solution (14,025-092), were all purchased from Gibco. HEPES (BP299-1) and PBS (BP2944) were procured by Fisher BioReagents. Hydrogen peroxide solution (H1009), D-(+)-Glucose (G7021) and chloroquine (C6628) were all purchased from Sigma-Aldrich. Etoposide (HY-13629) was purchased from MedChemExpress, paraformaldehyde 4% fixative (22,023) from Biotium, and the antifade mounting medium containing DAPI (H-2000) from Vector Laboratories, Inc. The TRIzol Reagent (15,596,018), RIPA buffer (89,901), the cocktail of protease and phosphatases inhibitors (78,422), the Qubit protein assay kit (Q33211), SuperBlock Blocking Buffer in PBS (37,515), SuperSignal West Pico Plus Chemiluminescent Substrate (34,578), and No-Stain Protein Labeling Reagent (A44449), were all acquired from ThermoFisher Scientific. All laboratory plastic ware, unless otherwise stated, were procured by Sarstedt AG & Co. KG.
Bioinformatics analysis, oligos and plasmids
Ensembl Genome database (Ensembl release 112; http://www.ensembl.org↗) was used to identify orthologous genes to the human genes coding for the main eMI players in the genome of RT (Genome assembly: USDA_OmykA_1.1), or of Danio rerio (Genome assembly: GRCz11), and their identity was later confirmed using Genomicus version 110.0152. To screen whether the identified genes are expressed across different tissues of RT and zebrafish, we interrogated the PhyloFish RNA-seq database35. Instead, to evaluate their expression in RTH-149 cells, we performed a Bulk RNA barcoding and sequencing (BRB-seq) analysis53 using the services of Alithea Genomics S.A as explained below.
Regarding oligos, up to four new siRNAs against the RT tsg101 mRNA sequence (Ensembl ID-gene: ENSOMYG00000006944) were designed using the siDESIGN Center. After testing their efficiency in reducing both mRNA and protein levels of Tsg101 by qPCR and western blot (data not shown), the most effective was selected for following experiments (sitsg101; 5′-UGAUUAGGUGAGCGAAUUA-3′). The different siRNAs using in the present work, including the siRNAs against the two RT lamp2a's (i.e., si14; 5′-UAAAGAAAUUGCUCGGCUC-3′, and si31; 5′- UGGAGAAGCGGCUGUGUUA-3′, previously validated for RT20, and a negative control siRNA against LucGL2 (siLUC; 5′-CGUACGCGGAAUACUUCGA-3′), not expressed in RT cells, were purchased from Horizon Discovery. On the other hand, a morpholino oligonucleotide (Moatg7; 5′-CAGAAGCCATCTCTATCACCG-3′) was designed in collaboration with GeneTools customer support to targeting the start codon of the RT atg7 mRNA sequence (Ensembl ID-gene: ENSOMYG00000075941) for blocking its translation. Besides, two different splice junction-targeting morpholinos were designed, each directed against pairs of RT bag6 paralogs. The first targeted the paralogs located on chromosomes 2 and 3 (Ensembl gene IDs: ENSOMYG00000013461 and ENSOMYG00000018793; designated Mobag6chr2&chr3; sequence: 5′-CAGACAGCATTACTCACTGTAC-3′). The second targeted the paralogs located on chromosomes 18 and 32 (Ensembl gene IDs: ENSOMYG00000034772 and ENSOMYG00000023282; designated Mobag6chr18&chr32; sequence: 5′- TAGTTGCTGGCTTTTTTACTCAC-3). A standard negative control morpholino (MoSTD-; sequence: 5′-CCTCTTACCTCAGTTACAATTTATA-3′), targeting against an intronic region of the human β-globin gene associated with β-thalassemia, was also designed. All morpholinos were purchased from GeneTools.
Concerning plasmids, two constructions originally designed for tracking eMI in Drosophila33 and based on the backbone pUAST-attB (RRID:DGRC_1419) plus the 21st amino acids of RNASe A, including its KFERQ motif, fused to either the N- or C-Split Venus54, were gifted by Patrik Verstreken (KU Leuven). Those two plasmids were digested to isolate the N- and C-Split Venus regions tagged to the KFERQ motif, for their posterior sub-cloning in the backbone of the pEGFP-N1-ro1GFP [a gift from S. James Remington (Addgene plasmid #82369; http://n2t.net/addgene:82369↗; RRID:Addgene_82369)] for a suitable expression in RT cells, but only after the removal of the EGFP sequence. The KFEAA-N-Venus was synthetized by Genewiz (Azenta Life Sciences) and inserted in the same pEGFP-N1-ro1GFP backbone detailed before. The KFEAA-C-Venus was also synthetized by Genewiz but inserted in the pCMV6-G2-ATP8-V5 plasmid [a gift from Matthew O'Connor (Addgene plasmid # 86852; http://n2t.net/addgene:86852↗ ; RRID:Addgene_86852). Moreover, mRFP-Rab7 plasmid was a gift from Ari Helenius (Addgene plasmid #14436; http://n2t.net/addgene:14436↗; RRID:Addgene_14436).
Cells and general experimental procedures
The RT hepatoma-149 cell line (RTH-149 cells; supplied by ATCC #CRL-1710; RRID:CVCL_3467), passage number below 20, and routinely screened to confirm absence of mycoplasma contamination by using the Myco-Sniff Mycoplasma PCR Detection Kit (MP Biomedicals #093050201) following the manufacturer's recommendations, was used for all cell culture experiments in the current work. This cell line has been previously validated as a reliable model for nutrition and autophagy research in the RT20,49. Cells were grown at 18 °C without CO2 in complete medium (hereafter referred as control condition, CT) consisting in Minimum Essential Medium containing essential amino acids, 1X L-glutamine and glucose (5 mM), and supplemented with 1X non-essential amino acids, sodium pyruvate (1 mM), HEPES (25 mM), 1X Penicillin–Streptomycin, and 10% fetal bovine serum.
RTH-149 cells stably transfected with the two N- and C-Split Venus regions tagged to the KFERQ motif were selected for the resistance to the selective antibiotic geneticin, followed by cell sorting using a FACS Aria 2-Blue 6-Violet 3-Red 5-YelGr, 2 UV laser configuration (BD Biosciences, Le Pont de Claix Cedex, France) in biosafety cabinet. RTH-149 cells transfected to stably express the mutated KFERQ motifs (i.e., KFEAA-N-Venus and KFEAA-C-Venus) were selected for their resistance to both the selective antibiotics neomycin and puromycin. On the other hand, RTH-149 cells stably expressing a KFERQ-PA-mCherry1 generated and selected in our previous work20 were additionally used for tracking CMA. Those eMI- or CMA-reporter cells, respectively, were maintained in a version of the CT medium detailed above in which the antibiotic used was geneticin. All the cells transfections with either plasmids (1–2.5 µg), siRNAs (1 µM) or morpholino oligos (5 µM), were performed with the Transfection System device (Invitrogen MPK5000) and Neon 100 µL samples Kit (Invitrogen MPK10096).
At the beginning of each experiment, similar to what was previously detailed in Vélez et al.20, cells were counted using a Cellometer K2 device (Bioscience LLC, Lawrence, MA, USA) and plated at a density of 60.000 cells/well onto 4-well culture slides (Ibidi 80426 or FALCON 354114) for Venus or mCherry microscope imaging experiments, respectively. In the case ofRNA extraction and both protein collection and IEM experiments, cells were plated in 6-cm dishes at 400.000 or 500.000 cells/dish, respectively. Before experimental treatments, the cells were gently washed twice with 1X PBS, and then incubated with CT medium alone, or supplemented with either hydrogen peroxide (25 μM, H2O2 medium, mild-oxidative stress), High-Glucose (D-glucose at 25 mM), or etoposide (50 µM), as appropriate and for the times detailed elsewhere. Otherwise, cells were incubated with H2O2 medium supplemented with chloroquine (CQ condition, 10 µM), or instead, with 1X Hank's Balanced Salt Solution supplemented exclusively with HEPES (25 mM, HBSS condition, serum and nutrient starvation medium), or also with 1X essential amino acids, 1X non-essential amino acids, and 1X L-glutamine (-FBS condition, serum starvation medium). To asses CMA activity, the CMA-reporter expressing cells were photoactivated with a 405-nm light source for 10 min prior to starting the incubations20.
Imaging procedures
Cells were fixed for 20 min using paraformaldehyde 4% before mounting and counterstaining nuclei with DAPI, and then the images were acquired in the Bordeaux Imaging Center (CNRS-INSERM and Bordeaux University, member of the national infrastructure France BioImaging). On the one hand, all cells images of KFERQ-Venus and mRFP-Rab7 fluorescence were acquired in widefield using a 20X/0.95 dry objective and a 1X intermediate lens with the high-content screening microscope Zeiss Cell Discoverer 7 (Zeiss Microscopy, Germany), which is equipped with Dual Zeiss Colibri LED-based illumination (from 385 to 625 nm), the dichroic mirrors 405/493/575/653, 450/538/610, 405/493/610, the emission filters 412-438/501-527/583-601/662-756, 458-474/546-564/618-756, 412-433/501-547/617-758, the color camera Zeiss Axiocam 512 as a detector, and its controlled by the Zen Blue 3.1 software (Zeiss). On the other hand, as reported before20, for imaging CMA-reporter cells we used a widefield Microscope Leica DM 5000 (Leica Microsystems, Germany) equipped with a 40X/1.25 oil objective, DAPI and TRITC filter cubes, a Greyscale sCMOS camera (Hamamatsu Flash 4.0 V2, Japan), and controlled by MetaMorph v7.8.10.0 software (RRID:SCR_002368).
eMI-reporter puncta per image were automatically detected in the Venus-channel and counted with Fiji (RRID:SCR_002285) by using the ComDet v.0.5.5 plugin (developed in Cell Biology group of Utrecht University and available at https://github.com/UU-cellbiology/ComDet↗), with an approximate particle size of 4 pixels and an intensity threshold ranging from 5 to 20 SD as settings. Next, the number of nucleus (> 100 pixels) in each image were counted by using the Fiji Analyze Particles function in the DAPI channel after IsoData thresholding and watershed segmentation. In the case of PA-mCherry1 fluorescence experiments, the CMA puncta were counted on images in gray (red channel) and blue (DAPI) by using the Cell Counter plugin of Fiji (RRID:SCR_002285) as previously detailed20, followed by nuclei counting. All images were counted in blind and random order and excluding cells on the edges or very superposed. For each image, the number of either eMI- or CMA-puncta was normalized by the number of nuclei within the image, and the results showed represent the number of puncta per cell in a minimum of 60 images coming from 3 independent experiments. In all cases, more than 600 cells/condition were counted.
The BIOP version (https://github.com/BIOP/ijp-jacop-b↗) of the original JACoP plugin (RRID:SCR_025164) for Fiji was used to evaluate the co-ocurrence between Venus-puncta and late endosomes labeled with mRFP-Rab7 in cells incubated with H2O2 medium. We analyzed in 85 single cells the PCC, which ranges from − 1 to 1, where − 1 indicates a negative correlation and + 1 highlights a complete positive correlation, between the pixel-intensity of the two contrasted channels38.
For IEM, cells were fixed for 1 h using a solution of paraformaldehyde 2% and glutaraldehyde 0.1% in PBS. After chemical fixation, cells were scrapped and pelleted in 12% gelatin. Small pieces were cut and incubated in 2.3M sucrose overnight at room temperature. Each sample were immersed in liquid nitrogen, and then sliced in ultrathin Sect. (70 nm) at − 120 °C with a 35° angle diamond knife (Diatome®) and collected on nickel grid (Electron Microscopy Sciences). Immunogold labeling of Venus proteins were achieved on section with a goat anti-Venus polyclonal first antibody (Antibodies.com, A121679), followed by secondary antibody donkey-anti-goat IgG (H&L) coupled with a 10 nm gold particules (Aurion). At the end, contrasts were performed with a solution of 1% aqueous uranyl acetate in 2% methylcellulose for 10 min in ice in the dark. Sections were imaged using a Hitachi H7650 transmission electron microscope equipped with a Gatan Orius CCD camera, as previously described55. MVBs were identified using previously established criteria56,57.
mRNA levels analysis: BRB-seq and quantitative RT-PCR
RNA samples were collected and processed with TRIzol reagent following the manufacturer's protocol. Then, RNA concentration was determined using a NanoDrop 2000 (Thermo Scientific) and integrity confirmed in an agarose gel, as previously reported58. In the case of Bulk RNA barcoding and sequencing (BRB-seq) analysis53, 8 independent RNA samples (50 ng of RNA/each) were collected and isolated from RTH-149 cells cultured in growth medium and successively sent to Alithea Genomics S.A for its processing as explained in detail elsewhere22. On the other hand, for quantitative RT-PCR the samples were prepared as described before49,55 and cDNA synthesis was performed in duplicate, followed by duplicated PCR analysis20. The relative quantification of the target gene tsg101 and of all bag6 paralogs was calculated using the ΔCT method59 with eef1a1 (eukaryotic translation elongation factor 1 alpha 1) as a reference gene. Primers used for tsg101 (forward: 5′-CCAGTCAGCTACAGAGGAAACA-3′/reverse: 5′-AGATCTTGCCGTTGGCATCA-3′) and for all bag6 paralogs (forward: 5′-CTGCAGGATGAGAGGAC-3′/reverse: 5′-TGCTGGTGCTGACTCTG-3′) were designed in the current work by using the Primer-Blast tool of NCBI, and the amplicons were sent to Genewiz (Azenta Life Sciences) to confirm primer specificity by Sanger Sequencing. Primers used for eef1a1 (forward: 5′-TCCTCTTGGTCGTTTCGCTG-3′/reverse: 5′-ACCCGAGGGACATCCTGTG-3′) were previously validated60.
Western blotting
Proteins were collected with RIPA buffer supplemented with protease and phosphatases inhibitor49, and then quantified using a Qubit 2.0 fluorometer (ThermoFisher Scientific). Later, 5 µg of protein were separated by sodium dodecyl sulfate polyacrylamide gel electrophoresis (SDS-PAGE) and then proteins were transferred to polyvinylidene fluoride (PVDF) membranes (Merk-Millipore IPFL00010). Next, total protein labeling was performed with No-Stain Protein Labeling Reagent following the manufacturer's protocol for posterior accurate total protein normalization. After blocking membranes with SuperBlock Blocking Buffer in PBS, they were incubated with the corresponding primary antibody rabbit anti-TSG101 (Sigma-Aldrich HPA006161, at 1/500), rabbit anti-LC3B (Cell Signaling Technologies 2775, at 1/1000), or rabbit anti-ATG5 (Novus, NB110-53818), followed by incubation with a goat anti-rabbit secondary antibody HRP (Invitrogen 31460, at 1/10,000). Immunoreactive bands were developed thanks to the SuperSignal West Pico Plus Chemiluminescent Substrate, and imaged using Smart Exposure to assure signal linearity in an iBright FL1500 Imaging System (ThermoFisher Scientific). Finally, the images were quantified using the iBright Analysis Software (ThermoFisher Scientific, RRID:SCR_017632). Full-length blots are available in the supplementary Fig. 3.
Statistics and reproducibility
All statistical analyses in the current study were performed using GraphPad Prism (RRID:SCR_002798) version 8.0.1 for Windows (GraphPad Software, Inc., www.graphpad.com↗) considering a p value < 0.05 as a level of significance, and all data presented are reported as means ± SEM or fold induction respect the control group ± SEM, from a minimum of 3 independent experiments. Before performing parametric or non-parametric tests, Normal distribution was assessed. The differences between two groups were evaluated through a parametric two-tailed unpaired Student's T-test, or a non-parametric Mann Whitney test. Instead, for the comparison between more than two groups in Fig. 2B, Kruskal–Wallis followed by Dunn's multiple comparisons test was utilized.
Supplementary Information
Below is the link to the electronic supplementary material.
Supplementary Material 1