
What this is
- This research investigates glucose-dependent insulinotropic polypeptide () secretion in human duodenal organoids.
- The study employs to create genetically modified organoids for functional characterization of K cells.
- Findings reveal that glucose and amino acids significantly stimulate secretion through specific receptor pathways.
Essence
- Human K cells in duodenal organoids secrete in response to glucose and amino acids, with mechanisms involving sodium glucose co-transporters and G protein-coupled receptors.
Key takeaways
- Glucose triggers a 1.8-fold increase in secretion from human K cells. This secretion is dependent on sodium glucose co-transporter activity, as shown by the inhibition with sotagliflozin.
- Amino acids phenylalanine and tryptophan stimulate secretion by 2.1-fold and 2.8-fold, respectively. This indicates that K cells respond to various nutrient signals.
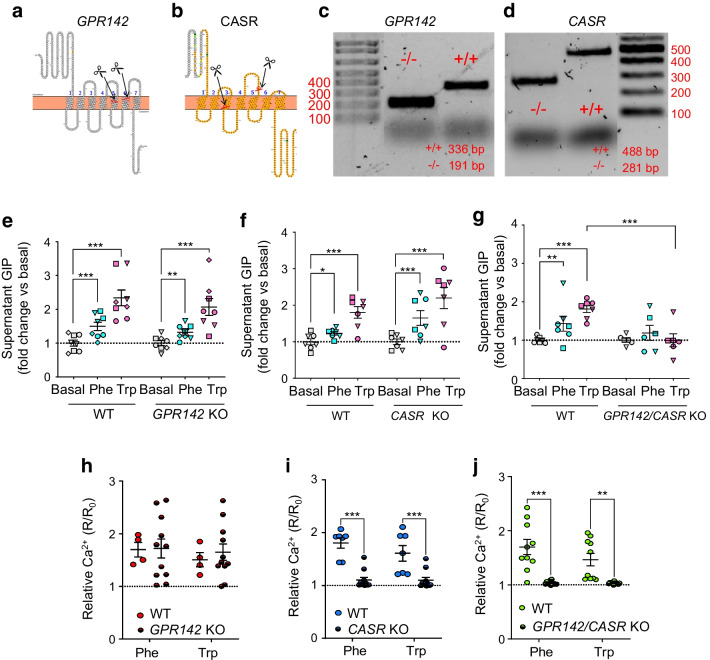
- Both calcium-sensing receptor (CASR) and G protein-coupled receptor 142 (GPR142) are involved in secretion, with double knockout of these receptors significantly impairing the response to aromatic amino acids.
Caveats
- The study primarily uses in vitro models, which may not fully replicate in vivo physiological conditions. Further research is needed to validate findings in human subjects.
- While the organoid model is innovative, it may not capture all aspects of K cell function in the human body, particularly in complex metabolic environments.
Definitions
- GIP: A hormone secreted by K cells in the intestine that stimulates insulin secretion in response to glucose.
- CRISPR-Cas9: A gene-editing technology used to modify DNA sequences and regulate gene expression.
Simplified
Introduction
Glucose-dependent insulinotropic polypeptide (GIP) is secreted by enteroendocrine K cells in the duodenum and plays a major role in the physiological incretin effect, alongside its sister incretin glucagon-like peptide 1 (GLP-1) [1]. Whereas GLP-1 forms the basis for many glucose-lowering and anti-obesity drugs such as liraglutide and semaglutide [2, 3], GIP-based therapeutics have lagged behind due to early concerns that GIP had only weak activity in the context of type 2 diabetes [4]. However, GLP-1 receptor (GLP1R)/GIP receptor (GIPR) dual agonists have now arrived on the market and induce more weight loss and better glucose control than many current drugs targeting GLP1R alone [3, 5], reigniting interest in human GIP physiology.
Plasma GIP concentrations in humans rise rapidly following oral glucose ingestion and act as an early signal to pancreatic islets that glucose is being absorbed [6]. Robust GIP responses are also observed after ingestion of meals containing carbohydrates, fats or proteins [7, 8]. At the cellular and molecular levels, characterisation of human enteroendocrine cells (EECs), including GIP-secreting K cells, is currently lacking because of an absence of in vitro models. In mice, glucose-triggered GIP secretion has been attributed to sodium glucose co-transporter 1 (SGLT1) activity, and a variety of nutrient-responsive G protein-coupled receptors (GPCRs) such as the long-chain free fatty acid receptor 1 (FFAR1) have been implicated in GIP responses to different macronutrients [1]. Understanding how human K cells sense nutrients and other stimuli is key to explaining postprandial physiology and unlocking the therapeutic potential of K cells as drug targets, potentially in combination with a dipeptidyl peptidase-4 (DPP4) inhibitor to prolong the plasma half-life of GIP. The generation of organoids from intestinal biopsies, which can be genetically modified by CRISPR-Cas9, has allowed these questions to be approached using reproducible in vitro human models [9].
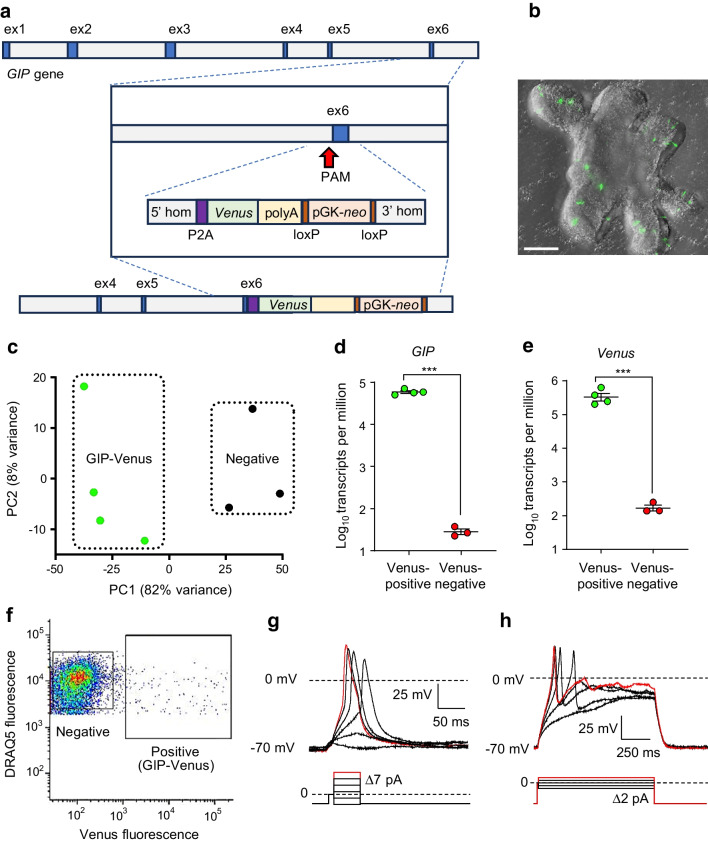
The aims of this study were to label and functionally characterise human K cells. K cells in human duodenal organoids were genetically engineered using CRISPR-Cas9 to express either the yellow fluorescent protein (YFP) Venus or the fluorescence resonance energy transfer (FRET)-based cAMP sensor Epac-S-H187. These reporter organoid lines were used to characterise K cells by RNA-seq, live-cell calcium and cAMP imaging, electrophysiology and in vitro GIP secretion assays. CRISPR-Cas9 was used to knockout (KO) two GPCRs, GPR142 and CASR, to evaluate their contributions to amino acid (AA) detection by human K cells.
Methods
Human organoid culture and maintenance
Human duodenal organoids were generated from anonymous surgical samples from Addenbrooke's Hospital Tissue Bank (Cambridge, UK), under ethical approval by the East of England–Cambridge Central Research Ethics Committee (no. 09/H0308/24). Duodenal organoids were generated and maintained as previously described [10, 11]. Cultures were fed twice weekly and passaged every 7–14 days. For passaging, one mature dome of organoids was incubated in Gibco TrypLE (Thermo Fisher, Bishops Stortsford, UK) at 37°C for 6–8 min, mechanically sheared using a pipette and seeded into pre-warmed 12-well plates. To promote K cell differentiation, EGF was removed 2–3 days after seeding (while retaining IGF1 and FGF2, called IF medium [12]) for 10–14 days. Cultures were then supplemented with 10 μmol/l Notch inhibitor DAPT (Generon, Slough, UK) and 100 nmol/l MEK inhibitor PD0325901 (Merck, Gillingham, UK) overnight. Subsequently, domes were cultured in IF medium until optimal K cell differentiation was achieved (3–7 days later).
Generation of GIP-Venus human duodenal organoids
CRISPR-associated protein 9 (Cas9) induced homology-directed repair (HDR) was used to knock in either Venus or the FRET cAMP reporter Epac-S-H187 [13] following a picornavirus peptide-2A (P2A) sequence to enable bicistronic expression under control of the GIP promoter. A CRISPR site (GGTCAGAGTCACCGAGACCTGGG)—the protospacer adjacent motif (PAM) is highlighted in bold—in exon 6 was targeted. Single guide RNA (sgRNA)-Cas9 and donor plasmids were generated, purified and prepared for electroporation, as described previously [10, 11] and in the electronic supplementary material (ESM) Methods. Successful recombinants were enriched by adding G418 (0.5 mg/ml) to media 3–7 days after electroporation. Surviving organoids were manually picked and seeded individually in basement membrane extract (BME) domes. DNA was extracted from each organoid using QuickExtract DNA Extraction Solution (Lucigen Corporation, USA) and successful integration was assessed by PCR genotyping and confirmed by Sanger sequencing (Source Bioscience, Cambridge, UK).
Generation ofandKO GIP-Venus human duodenal organoid lines GPR142 CASR
CRIPSR-Cas9 non-homologous end joining (NHEJ) was used to KO GPR142 and CASR. GPR142 guides (TGACCAGGAACACGCCACAAGGG, GGTAGAGCATGACGAAGACCCGG) targeted transmembrane domains 5 and 6 (exon 4); CASR guides (GGACACGGTTGGTTTTCACCAGG, ATCTTCATCACGTGCCACGAGGG) targeted transmembrane domain 3 and extracellular loop 2 (exon 7). Guide sequences were cloned into plasmids for electroporation as above. Genomic DNA was extracted and screened by PCR amplification to identify clones with biallelic deletions.
cDNA library preparation and RNA-seq
RNA extraction and sequencing were performed after FACS as previously described [10, 11] (see ESM Methods for further details). Gene expression is presented in transcripts per million. Differential expression was calculated using the Wald test (default in DESeq2 [14] version 1.42.0), comparing GIP-Venus positive vs negative. RNA-seq data are deposited in the National Center for Biotechnology Information–Gene Expression Omnibus (NCBI GEO) repository (GSE271017).
Peptidomic analysis
Peptide extraction and analysis of FACS-sorted cells were performed by LC-MS/MS as previously described [10, 11] (see ESM Methods for further details). Data have been deposited at the ProteomeXchange Consortium via the PRIDE partner repository (PXD052659).
Secretion assays
Differentiated organoids were liberated from domes using ice-cold advanced DMEM/F-12 medium (ADF) (Gibco, Thermo Fisher, Bishops Stortsford, UK) and centrifuged at 400 g for 4 min. Organoids were washed twice for 30 min at 37°C with saline buffer (composition defined below) supplemented with 1 mmol/l glucose and 0.1% BSA. Intact 3D organoids were distributed into V-bottom 96-well plates and incubated in duplicates or triplicates with test reagents dissolved in saline buffer for 2 h at 37°C. Subsequently, plates were centrifuged at 2000 g for 5 min at 4°C, and supernatants were snap-frozen prior to analysis. Total GIP levels were measured by electrochemiluminescence (ECL) immunoassay (MesoScale Discovery, Rockville, MD, USA, no. K1515SK).
Calcium and cAMP imaging
Calcium imaging was performed as previously described after loading with the acetoxymethyl ester of Fura-2 (Fura-2-AM) [10, 11, 15] (see ESM Methods for further details). cAMP-dependent FRET imaging was performed on GIP-Epac-S-H187 organoids as described previously [16] (see ESM Methods for further details).
Electrophysiology
Electrophysiological recordings were performed on fluorescently labelled K cells as previously described [10, 11] (see ESM Methods for further details).
Buffers
Saline buffer for imaging, electrophysiology and secretion contained (in mmol/l): 138 NaCl, 4.5 KCl, 4.2 NaHCO3, 1.2 NaH2PO4, 2.6 CaCl2, 1.2 MgCl2, 10 HEPES; adjusted to pH 7.4 with NaOH. Internal pipette solution for perforated patch recordings contained (in mmol/l): 76 K2SO4, 10 NaCl, 10 KCl, 10 HEPES, 55 sucrose, 1 MgCl2; adjusted to pH 7.2 with KOH. Amphotericin-B was dissolved in DMSO and added fresh to pipette solution at a final concentration of 200 µg/ml on the day of recording.
Randomisation
Most experiments outlined in this article were not randomised. If agonists were used sequentially during imaging or electrophysiological experiments the order of application was varied to minimise sequential effects.
Masking/blinding
For most experiments blinding was not possible. Exceptions are secretion experiments and peptidomic analysis, in which the staff analysing hormonal contents were blinded to the test conditions and sample identity.
Inclusion and exclusion criteria
All data collected were included in the analysis with the exception of cells not responding to positive controls in the live-cell imaging experiments, as stated in the Data analysis section.
Data analysis
Statistical tests were performed using GraphPad Prism (version 10, GraphPad Software, USA), DESeq2 (RNA-seq) or R (version 12, R Core Team, Austria), as indicated in individual figure legends. Cells in imaging experiments were included for analysis if they showed a response to the positive control: KCl (for Ca2+) or forskolin/3-isobutyl-1-methylxanthine (IBMX) (for cAMP). Cells were classified as 'responders' if the z score was >3 for at least two consecutive timepoints during perfusion of test substance; z score = [(Ft − mean Fb)/SD Fb], where Ft is the 340/380 or cyan/yellow fluorescent protein (CFP/YFP) ratio at time t, mean Fb is the mean basal fluorescence ratio calculated from 60 s of datapoints prior to test addition and SD Fb is the SD of Fb during the basal 60 s recording period.
Results
Generation of GIP-Venus and GIP-Epac-S-H187 human duodenal reporter lines
![Human GIP-Venus duodenal organoids are electrically excitable. () Schematic representing the knockin strategy to insert thetransgene in exon 6 of thegene using CRISPR-Cas9 HDR, allowing for bicistronic expression of thegene under the GIP promoter. () Representative image of a GIP-Venus human organoid generated using a Celldiscoverer 7 system, equipped with a Plan-Apochromat ×5 objective (numerical aperture [NA] 0.35) coupled with a ×2 tube lens and an Axiocam 506 CCD camera (Zeiss, Cambridge, UK). The Venus signal was imaged using a 470 nm light-emitting diode (LED) light source and 524/50 emission filter (depicted in green), and phase gradient contrast images using the transmission LED lamp. The image is a maximum projection over a 172.36 µm z-stack of 63 images. Effective voxel size is 0.459 × 0.459 × 2.780 µm. Scale bar, 100 µm. () PCA of GIP-Venus-positive (green) and negative (black) cell populations following bulk RNA-seq. (,) Differential() and() expression in Venus-positive (=4) and negative (=3) cell populations. Data are presented as mean ± SE; ***<0.001 by two-tailedtest. () Representative FACS plot. GIP-Venus-positive and negative cells were isolated based on Venus fluorescence intensity, after selection of live DAPI-negative and DRAQ5-positive cells only. () Representative traces of perforated patch, whole-cell current clamp recording of a Venus-positive K cell held at −70 mV in response to the injection of short depolarising pulses (50 ms) of increasing amplitude in 7 pA increments, as indicated. () As shown in () using longer current injection pulses (500 ms) at 2 pA increments, as indicated. ex, exon; PAM, protospacer adjacent motif; PC, principal component a b c d e d e f g h g Venus GIP Venus GIP Venus n n p t 3](https://europepmc.org/articles/PMC11663192/bin/125_2024_6293_Fig1_HTML.jpg "Click to view full size")
Human GIP-Venus duodenal organoids are electrically excitable. () Schematic representing the knockin strategy to insert thetransgene in exon 6 of thegene using CRISPR-Cas9 HDR, allowing for bicistronic expression of thegene under the GIP promoter. () Representative image of a GIP-Venus human organoid generated using a Celldiscoverer 7 system, equipped with a Plan-Apochromat ×5 objective (numerical aperture [NA] 0.35) coupled with a ×2 tube lens and an Axiocam 506 CCD camera (Zeiss, Cambridge, UK). The Venus signal was imaged using a 470 nm light-emitting diode (LED) light source and 524/50 emission filter (depicted in green), and phase gradient contrast images using the transmission LED lamp. The image is a maximum projection over a 172.36 µm z-stack of 63 images. Effective voxel size is 0.459 × 0.459 × 2.780 µm. Scale bar, 100 µm. () PCA of GIP-Venus-positive (green) and negative (black) cell populations following bulk RNA-seq. (,) Differential() and() expression in Venus-positive (=4) and negative (=3) cell populations. Data are presented as mean ± SE; ***<0.001 by two-tailedtest. () Representative FACS plot. GIP-Venus-positive and negative cells were isolated based on Venus fluorescence intensity, after selection of live DAPI-negative and DRAQ5-positive cells only. () Representative traces of perforated patch, whole-cell current clamp recording of a Venus-positive K cell held at −70 mV in response to the injection of short depolarising pulses (50 ms) of increasing amplitude in 7 pA increments, as indicated. () As shown in () using longer current injection pulses (500 ms) at 2 pA increments, as indicated. ex, exon; PAM, protospacer adjacent motif; PC, principal component a b c d e d e f g h g Venus GIP Venus GIP Venus n n p t 3
Transcriptomic and peptidomic analysis of human K cells
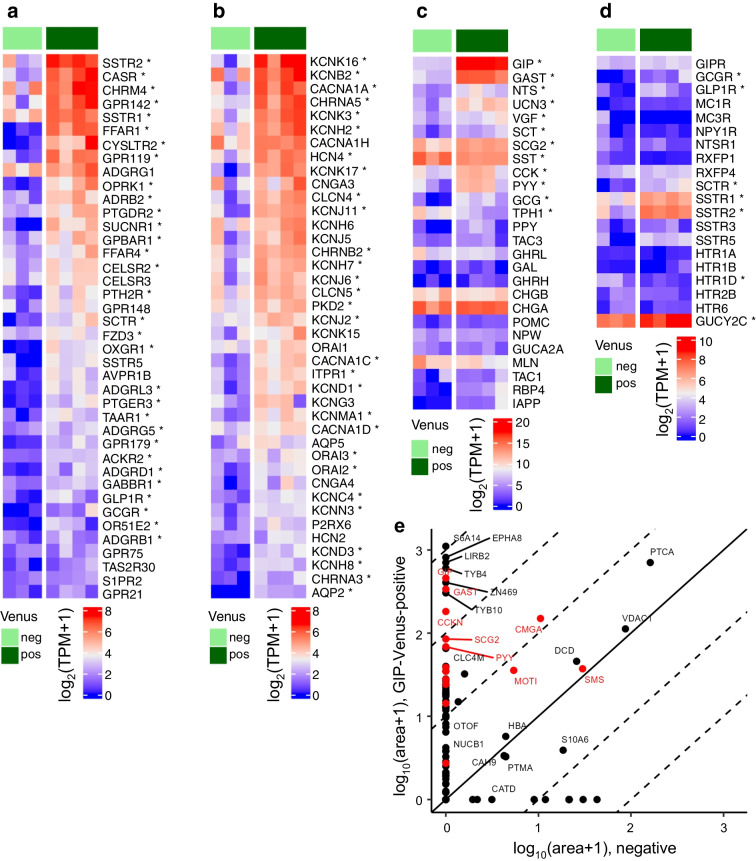
Mirroring previous observations in human GLP-1-secreting L cells [10], the GIP-Venus RNA-seq dataset showed differential expression of voltage-gated calcium channels important for action potential generation and vesicular exocytosis, including CACNA1A (P/Q type, Cav2.1) and CACNA1C (L-type) (Fig. 2b) [20]. CACNA1H (T-type) was also highly expressed in GIP-Venus K cells, but not enriched. In contrast to L cells [10], the voltage-gated Na+ channel SCN3A (Nav1.3) was not enriched in Venus-positive K cells, although detected. Expression of the voltage-gated K+ channel KCNB2 and hyperpolarisation-activated cyclic nucleotide-gated channel HCN4 was enriched (Fig. 2b). LC-MS/MS peptidomic analysis of isolated Venus-positive K cells confirmed production of several gut hormone and neuroendocrine secretory peptides besides GIP, including gastrin, cholecystokinin (CCK), peptide YY (PYY), motilin, somatostatin (SST), chromogranin-A and secretogranin II (Fig. 2e).
![Transcriptomic and peptidomic characterisation of Venus-positive K cells. (–) Heatmaps showing: () top 40 highest expressed GPCRs; () top 40 ion channels and transporters; () gut peptides (plus tryptophane hydroxylase 1 [TPH1], the enzyme critical for serotonin production in enterochromaffin cells); () receptors for enteroendocrine hormones. *Significant differential expression between GIP-Venus K cells compared with the Venus-negative population (FDR<0.05). () LC-MS/MS peptidomic analysis of purified GIP-Venus positive and Venus-negative cells (the individual peptides detected are combined and associated to the parental protein, labelled by protein name [SwissProt] and expressed as mean peak area). FDR, false discovery rate; neg, negative; pos, positive; TPM, transcripts per million a d a b c d e](https://europepmc.org/articles/PMC11663192/bin/125_2024_6293_Fig2_HTML.jpg "Click to view full size")
Transcriptomic and peptidomic characterisation of Venus-positive K cells. (–) Heatmaps showing: () top 40 highest expressed GPCRs; () top 40 ion channels and transporters; () gut peptides (plus tryptophane hydroxylase 1 [TPH1], the enzyme critical for serotonin production in enterochromaffin cells); () receptors for enteroendocrine hormones. *Significant differential expression between GIP-Venus K cells compared with the Venus-negative population (FDR<0.05). () LC-MS/MS peptidomic analysis of purified GIP-Venus positive and Venus-negative cells (the individual peptides detected are combined and associated to the parental protein, labelled by protein name [SwissProt] and expressed as mean peak area). FDR, false discovery rate; neg, negative; pos, positive; TPM, transcripts per million a d a b c d e
K cells are electrically active and secrete GIP upon glucose and α-MDG stimulation
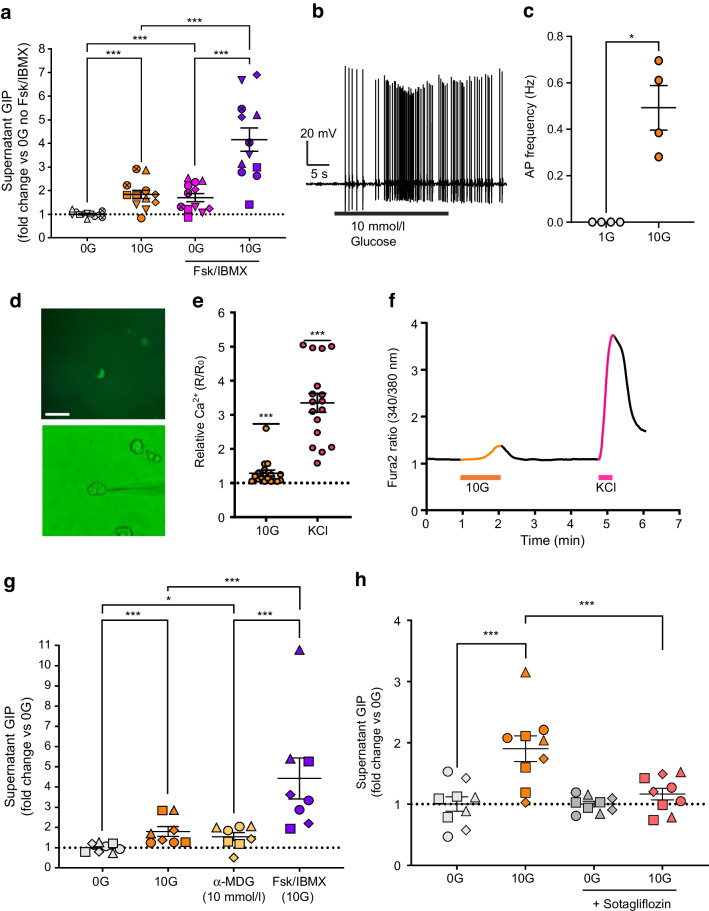
We further explored effects of glucose on GIP secretion in vitro and the potential underlying molecular mechanisms. Incubation of GIP-Venus organoids with glucose (10 mmol/l) triggered a 1.8 ± 0.2-fold (n=12) increase in GIP secretion, which was doubled in the presence of cAMP-raising agents forskolin (10 μmol/l) and IBMX (100 μmol/l) (Fig. 3a). Intracellular Ca2+ elevations were observed in 17/17 K cells perfused with glucose (10 mmol/l) (Fig. 3e, f). GIP secretion was also elicited by the SGLT1 substrate methyl α-d-glucopyranoside (α-MDG) (10 mmol/l; 1.5 ± 0.2-fold increase, n=8) (Fig. 3g). In the presence of the SGLT1/sodium glucose co-transporter 2 (SGLT2) inhibitor sotagliflozin, glucose-elicited GIP release was reduced from 1.9 ± 1.2-fold to 1.2 ± 0.1-fold (p<0.001; n=9) (Fig. 3h), supporting the idea that glucose-mediated GIP release is SGLT1-dependent.

Glucose triggers firing of action potentials and GIP secretion in human K cells. () Secretion of GIP from GIP-Venus human duodenal organoids following incubation with glucose (10 mmol/l; 10G), in the presence or absence of Fsk (10 μmol/l) and IBMX (100 μmol/l), expressed as fold change vs basal condition (0 mmol/l glucose; 0G) measured in parallel (=12 wells from six independent experiments; matching symbols indicate results from the same experiment). () Representative trace of perforated patch, whole-cell current clamp recording of a Venus-positive K cell initially perfused with 1 mmol/l glucose and exhibiting action potentials after perfusion with 10 mmol/l glucose, without current injection. () Mean action potential frequencies (Hz) of Venus-positive K cells recorded in 1 and 10 mmol/l glucose (G). () Images of Venus-positive K cells studied by perforated patch-clamp electrophysiology. K cells were identified by the expression of Venus (top panel) and patched using phase contrast (bottom panel). Scale bar, 50 μm. () Increase in intracellular calcium levels across different cells, shown as ratio between R (Fura-2 ratio during perfusion of stimulus) and R(Fura-2 ratio during perfusion of basal solution) (=17 cells from nine independent experiments). () Representative Fura-2 (340/380 nm) ratio trace of a single K cell perfused with glucose (10 mmol/l, orange) and KCl (positive control; 70 mmol/l, pink). () Secretion of GIP from duodenal organoids in response to glucose (10 mmol/l) and α-MDG (10 mmol/l). Control solution (0G) contained 0 mmol/l glucose. Fsk (10 μmol/l) and IBMX (100 μmol/l) with 10 mmol/l glucose were used as positive control (=8 wells from four independent experiments; matching symbols indicate results from the same experiment). () Inhibition of GIP release at 10 mmol/l glucose (10G) following 30 min pre- and 2 h co-incubation of duodenal organoids with sotagliflozin (5 μmol/l), expressed as fold change vs basal condition (0 mmol/l glucose; 0G) measured in parallel (=9 wells from four independent experiments; matching symbols indicate results from the same experiment). Data are presented as mean ± SE. *<0.05, ***<0.001. (,,) Linear regression and cluster-robust SE estimation with Huber–White SEs; () pairedtest; () one-sample Wilcoxon test. AP, action potential; Fsk, forskolin a b c d e f g h a g h c e n n n n p p t 0
Stimulation of GIP secretion by GPCR agonists
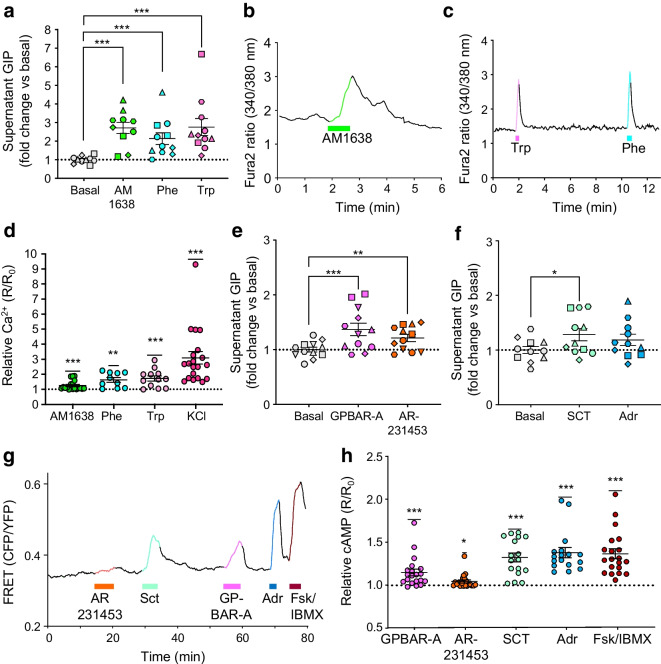
Compared with AM1638 and the aromatic AAs, the GPBAR1 agonist GPBAR-A (3 μmol/l) and GPR119 agonist AR231453 (100 nmol/l) appeared to have less marked effects on GIP secretion, inducing 1.3 ± 0.1-fold (n=12) and 1.2 ± 0.1-fold (n=12) increases, respectively (Fig. 4e). Secretin (100 nmol/l) and adrenaline (epinephrine) (30 μmol/l) also had small effects, inducing only 1.3 ± 0.1-fold (n=12) and 1.2 ± 0.1-fold (n=12) increases, respectively (Fig. 4f). As GPBAR1, GPR119, secretin receptor (SCTR) and beta-2 adrenergic receptor (ADRB2) are Gs-coupled, intracellular cAMP levels in K cells were monitored using the GIP-Epac-S-H187 line. Consistent with the detection of mRNA for these receptors, most tested Gs-coupled stimuli induced marked increases in cAMP levels of GIP-Epac-S-H187 cells (Fig. 4g, h), with the exception of the GPR119 agonist AR231453, which evoked only modest responses. GPBAR-A provoked a significant increase in the CFP/YFP ratio, a measure of intracellular cAMP, in 12/19 GIP-Epac-S-H187 cells, whereas responses to AR231453 were observed in 6/19 cells. Secretin and adrenaline induced CFP/YFP responses in 15/17 and 17/17 GIP-Epac-S-H187 cells, respectively (Fig. 4h).

Stimulation of GIP release by AAs, LCFAs, bile acids and other small molecules. (,,) Secretion of GIP from GIP-Venus human duodenal organoids in response to the stimuli indicated, expressed as fold change vs basal condition (1 mmol/l glucose) measured in parallel. The stimuli included AM1638 (10 μmol/l), phenylalanine (20 mmol/l), tryptophan (20 mmol/l), GPBAR-A (3 μmol/l), AR231453 (100 nmol/l), SCT (100 nmol/l) and adrenaline (30 μmol/l). All test solutions contained 1 mmol/l glucose (=10–12 wells from 5–6 independent experiments; matching symbols indicate results from the same experiment). (,) Representative Fura-2 (340/380) ratio traces of single K cells perfused with AM1638 (10 μmol/l) and aromatic AAs phenylalanine and tryptophan (20 mmol/l), as indicated by the horizontal bars. () Mean data collected as in (,), shown as ratio between R (Fura-2 ratio during perfusion of stimulus) and R(Fura-2 ratio during perfusion of basal solution) (=10–19 cells from 3–6 independent experiments). () Representative FRET (CFP/YFP) ratio trace of single K cell perfused with GPBAR-A (3 μmol/l), AR231453 (100 nmol/l), SCT (100 nmol/l), adrenaline (30 μmol/l) and positive control forskolin (Fsk)/IBMX (10 μmol/l/100 μmol/l), as indicated by the horizontal bars. () Mean data collected as in (), shown as ratio between maximal CFP/YFP ratio (R) during perfusion of stimulus and maximal CFP/YFP ratio (R) during perfusion of basal solution (=17–19 from 4–5 independent experiments). Data are presented as mean ± SE. *<0.05, **<0.01, ***<0.001. (,,) Linear regression and cluster-robust SE estimation with Huber–White SEs; (,) one-sample Wilcoxon test. Adr, adrenaline a e f b c d b c g h g a e f d h n n n p p p
Unravelling the role of GPR142 and CASR in AA sensing in K cells
GPR142 KO GIP-Venus K cells did not show any significant impairment of intracellular Ca2+ responses to phenylalanine and tryptophan compared with WT K cells (Fig. 5h). Both phenylalanine and tryptophan also stimulated GIP secretion in GPR142 KO organoids (1.3 ± 0.1- and 2.1 ± 0.2-fold [n=8 each], respectively), with no significant difference compared with WT organoids (1.5 ± 0.1- and 2.3 ± 0.2-fold [n=8 each], respectively) (Fig. 5e).
By contrast, intracellular Ca2+ responses to phenylalanine and tryptophan were significantly impaired in CASR KO K cells (Fig. 5i). Surprisingly, secretion of GIP from CASR KO organoids did not differ significantly from that of WT organoids, with both AAs significantly stimulating GIP secretion in the CASR KO (1.6 ± 0.2-fold increase by phenylalanine and 2.2 ± 0.3-fold increase by tryptophan [n=7 each]) (Fig. 5f).
Finally, we explored the effects of double GPR142 and CASR KO on intracellular Ca2+ and GIP secretion. Ca2+ responses to phenylalanine and tryptophan were significantly impaired in double KO K cells (Fig. 5j). Double KO organoids also showed impaired GIP release in response to phenylalanine and tryptophan (1.1 ± 0.2- and 1.0 ± 0.2-fold increase, respectively [n=6–7]) (Fig. 5g).

Unravelling the role of CASR and GPR142 in AA sensing in K cells. (,) Schematics representingandCRISPR-Cas9 KO strategy. Sequences between the scissors represent deleted regions. The topological structures of the two receptors were generated using Protter (version 1.0;). (,) Representative agarose gels showing PCR genotyping results for WT (+/+) and homozygous (−/−)() and() KO human GIP-Venus duodenal organoids; expected band sizes for WT and KO alleles are indicated in base pairs. (–) Secretion of GIP following stimulation with phenylalanine (20 mmol/l) and tryptophan (20 mmol/l) in WT andKO (),KO () and double KO () organoids, respectively. GIP release is expressed as fold change vs basal condition. All secretion experiments for KO lines were carried out in parallel with the WT line (=6–8 wells from 3–4 independent experiments; matching symbols indicate results from the same experiment). (–) Increase in intracellular calcium levels in response to phenylalanine (20 mmol/l) and tryptophan (20 mmol/l) across K cells derived from WT andKO (),KO () and double KO () organoids, respectively. The increase is shown as ratio between R (Fura-2 ratio during perfusion of stimulus) and R(Fura-2 ratio during perfusion of basal solution) (=4–11 cells from 3–4 independent experiments). Data are presented as mean ± SE. *<0.05, **<0.01, ***<0.001. (–) Linear regression and cluster-robust SE estimation with Huber-White SEs; (–) two-way ANOVA with Sidak's multiple comparisons a b c d c d e g e f g h j h i j e g h j GPR142 CASR GPR142 CASR GPR142 CASR n GPR142 CASR n p p p https://wlab.ethz.ch/protter/start/ 0
Discussion
The molecular characterisation of secretory mechanisms in K cells has relied heavily on mouse models and primary rodent intestinal cultures, in the absence of a human in vitro model. Using CRISPR-Cas9, we were able to insert the genes of fluorescent reporters at the 3′ end of the GIP gene in human duodenal organoids, enabling identification of living K cells in culture for downstream applications including FACS, RNA-seq, peptidomics, electrophysiology and live-cell imaging of Ca2+ and cAMP. Generation of the GIP-Venus and GIP-Epac-S-H187 reporter lines provides a breakthrough for characterising the cellular and molecular properties of human K cells in vitro.
Transcriptomic and peptidomic profiling of human K cells revealed expression and translation of an array of peptide hormones besides GIP. This includes gastrin and cholecystokinin, which aligns with previous observations made in neurogenin-3 (NEUROG3)-overexpressing human organoids [21]. Bulk RNA-seq revealed enriched expression of various nutrient- and hormone-sensing GPCRs and transporters in human K cells, aligning with previous observations showing mRNA enrichment of similar GPCRs and transporters in murine K cells by RT-PCR [22]. We report here that human K cells respond to a range of nutrients, hormones and small molecules, resulting in elevation of intracellular second messengers (Ca2+ and cAMP) and secretion of GIP. Importantly, we demonstrate for the first time that human K cells are electrically excitable and explore the role of AA-sensing receptors GPR142 and CASR in GIP secretion using CRISPR-Cas9 gene editing.
GIP secretion was stimulated by glucose and the non-metabolisable SGLT1 substrate α-MDG, and glucose-triggered GIP release was inhibited by sotagliflozin, an SGLT1/2 blocker used for management of diabetes and chronic kidney disease [23]. These results suggest that SGLT1 acts as the primary glucose sensor in human K cells, mirroring previous results from human physiological studies and mouse models. In humans, GIP secretion is triggered by oral but not intravenous administration of glucose [24, 25], and could also be stimulated by ingestion of 3-O-methyl glucose, a non-metabolisable SGLT1 substrate, but not by slowly absorbable saccharides [26], pointing towards the importance of sugar absorption. In mouse models, a number of pieces of evidence suggested that glucose-induced GIP secretion is due directly to the action of SGLT1: oral administration of α-MDG elevated circulating GIP levels [27]; in mouse primary intestinal cultures, the SGLT1 inhibitor phloridzin abolished glucose-triggered GIP release [22]; and in Sglt1 KO mice the expected increase in circulating GIP following an oral glucose load was lost [28]. The mechanism of SGLT1-dependent glucose sensing is believed to involve the coupled entry of two Na+ ions with each glucose molecule, leading to membrane depolarisation as described previously in L cells [29, 30]. Consistent with this idea, action potential firing in human K cells was triggered by glucose elevation. Interestingly, we observed that the four fluorescent K cells recorded in this study did not exhibit spontaneous action potentials in 1 mmol/l glucose, unlike other EEC types from which we have recorded [10, 11]. With the low number of cells recorded, however, it is not possible to conclude whether this is a feature of human K cells, or a consequence of the specific culture conditions.
We studied the function of a variety of Gs-coupled receptors identified in the RNA-seq analysis, including GPR119, GPBAR1, ADRB2 and SCTR. GIP secretion was modestly stimulated by the GPR119 agonist AR231453, with a corresponding increase in intracellular levels of cAMP in human K cells. This supports the finding that, in human volunteers, ingestion of C4-dietary oil, a prodrug for the GPR119 agonist 2-oleoyl glycerol, enhanced the GIP response to a carrot meal [31]. Similarly, oral gavage of WT mice with AR231453 stimulated GIP release which was impaired in Gpr119 KO mice [32]. The GPBAR1 agonist GPBAR-A also increased K cell cAMP levels and GIP secretion from human organoids. The role of bile acids in the physiological modulation of GIP release remains unclear: while intraluminal administration of bile acids triggered GIP secretion in the perfused rat intestinal model [33], healthy volunteers taking the GPBAR1 agonist chenodeoxycholic acid surprisingly exhibited reduced meal-stimulated GIP release [34]. Adrenaline and secretin (SCT) had limited effects on GIP secretion in vitro, but robustly raised cAMP in the majority of the K cells assayed. β-Adrenergic stimulation has been shown previously to increase plasma GIP levels in healthy volunteers [35], but effects of SCT have been tested only in the context of a meal, when they were found not to affect postprandial GIP levels in healthy individuals [36]. Organoid GIP secretory responses to Gs-coupled receptor activation were noticeably smaller than those to Gq-coupled receptor agonism, but the secretion experiments were performed in 1 mmol/l glucose where spontaneous electrical activity was low. As cAMP sensitises exocytotic machinery to raised Ca2+ in other endocrine cell types [37], the results suggest that K cell Ca2+ levels under these conditions were close to the threshold for cAMP-dependent secretion. While we did not test the effect of predominantly Gi-coupled receptors in this study, including the enriched SST receptor subtypes and the dynorphin (κ-opioid) receptor encoded by OPRK1, we would expect these to inhibit stimulated GIP secretion, in line with previous observations on mouse K cells, which are inhibited by SST and endocannabinoid 1 receptor (CB1) agonist [38]. Given that Venus-positive K cells also co-express SST, this could act as an autocrine break on GIP secretion, although we cannot exclude a contribution of SST-expressing D cells, which would underlie the SST signal in the Venus-negative population. The predominantly Gs-coupled GIPR itself was detectable, opening the possibility that there is also an autocrine feed-forward loop in operation in K cells. However, previous research has demonstrated the importance of SST for GIP secretion, as SST-neutralising antibodies increased glucose-stimulated GIP secretion in both the STC-1 cell line model [39] and elutriated canine K cells [40].
Gq activation triggered robust elevation of Ca2+ and GIP secretion in human K cells, including agonists for FFAR1, CASR and GPR142. AM1638 was a strong stimulus of Ca2+ elevation and GIP secretion, suggesting a role for FFAR1 in LCFA-mediated GIP release in humans. This coincides with previous reports that plasma GIP is elevated following oral olive oil or corn oil gavage in WT mice, which was blunted in Ffar1 KO animals [41]. FFAR4 agonism was not tested because K cell expression of FFAR4 was fourfold lower than FFAR1, and because we previously observed no responses to the FFAR4-specific agonists TUG891 (1 μmol/l) or compound A (1 μmol/l) in human MLN-labelled duodenal organoid cells which expressed >3 times more FFAR4 than the K cells in the current study [11]. Phenylalanine and tryptophan, known ligands for CASR and GPR142, similarly triggered robust elevation of K cell Ca2+ and GIP secretion from human organoids, supporting reports that intraduodenal delivery of an AA mix [42] or glutamine [43] stimulated GIP secretion in healthy volunteers. We further investigated the molecular mechanism underlying AA-triggered GIP release in human organoids, as both GPR142 and CASR have been proposed as K cell AA sensors. In mice, tryptophan-triggered GIP secretion was abolished in Gpr142 KO animals [44], and in perfused pig duodenum studies, phenylalanine-triggered GIP secretion was blunted by the CASR antagonist NPS-2143 [45]. We therefore examined the effects of knocking out CASR or GPR142 alone or in combination in GIP-Venus organoids. Unlike in mouse studies, GPR142 KO in human organoids had no effect on either GIP secretion or K cell Ca2+ responses to tryptophan or phenylalanine, suggesting that GPR142 is not essential for AA-mediated GIP stimulation in humans. CASR KO reduced K cell Ca2+ responses to tryptophan and phenylalanine but did not impair AA-triggered GIP secretion, so while CASR might play a role in acute Ca2+ responses to these AAs, other mechanisms seem to contribute to AA-stimulated GIP release over 2 h. In double KO organoids acute Ca2+-responses to tryptophan and phenylalanine were further diminished, and tryptophan-induced GIP release was significantly reduced. Our results therefore suggest that both CASR and GPR142 are needed in K cells to mount a full response to aromatic AAs, with CASR playing a key role in mediating the Ca2+ responses. Even though secretory responses to phenylalanine and tryptophan did not reach significance in the double KO, apparent responses in some experiments suggest the presence of additional pathways, potentially involving AA absorption and metabolism, and further pharmacological and KO studies are necessary to elucidate the potential role of AA transporters in GIP secretion from human K cells. Responses to other AAs such as branched chain AAs were not tested in the current study, as previous results in humans with leucine and isoleucine were inconsistent [46 –48].
Conclusions
Human K cells are directly responsive to a range of nutritional-related stimuli, including glucose, fatty acids and aromatic AAs. Differential expression of a number of nutrient-sensing GPCRs and transporters was identified in GIP-Venus cells, shedding light on potential molecular mechanisms orchestrating nutrient and small molecule sensing in human K cells. GIP secretion was strongly elicited by SGLT1 substrates, FFAR1 agonism and aromatic AAs. Glucose-mediated GIP release was mediated by SGLT1, as demonstrated by its sensitivity to the SGLT1/2 inhibitor sotagliflozin, correlating with the glucose-dependent membrane depolarisation and action potential firing evident in human K cell electrophysiological recordings. The application of CRISPR-Cas9-mediated gene KO in human intestinal organoid models, used here to demonstrate the joint contribution of GPR142 and CASR to AA-triggered GIP release, promises to be a powerful tool to dissect the physiological importance of receptors, ion channels and transporters for which specific pharmacological tools are lacking. Characterising the mechanisms underlying K cell nutrient sensing will facilitate our understanding of the human gut–brain–pancreatic axis and how it could be targeted for the treatment of metabolic diseases.
Supplementary Information
Below is the link to the electronic supplementary material. ESM (PDF 157 KB)